J Res Health Sci. 25(2):e00650.
doi: 10.34172/jrhs.2025.185
Original Article
Spatiotemporal Mapping of Colorectal and Gastric Cancer Incidence in Hamadan Province, Western Iran (2010-2019)
Erfan Ayubi Conceptualization, Data curation, Formal analysis, Investigation, Methodology, Project administration, Software, Supervision, Validation, Visualization, Writing – original draft, Writing – review & editing, 1 
Sharareh Niksiar Data curation, Investigation, Software, Writing – review & editing, 2
Zahra Keshtpour Amlashi Investigation, Writing – review & editing, 1
Elaheh Talebi-Ghane Conceptualization, Formal analysis, Investigation, Methodology, Project administration, Software, Supervision, Validation, Visualization, Writing – review & editing, 3, *
Author information:
1Cancer Research Center, Institute of Cancer, Avicenna Health Research Institute, Hamadan University of Medical Sciences, Hamadan, Iran
2Hamadan Cancer Registry, Hamadan University of Medical Sciences, Hamadan, Iran
3Modeling of Noncommunicable Diseases Research Center, Institute of Health Sciences and Technologies, Avicenna Health Research Institute, Clinical Research Development Unit of Fatemieh Hospital, Hamadan University of Medical Sciences, Hamadan, Iran
Abstract
Background: Exploring the pattern of diseases in space and time enhances our understanding of truly needy areas. The present study aimed to explore spatiotemporal mapping of colorectal cancer (CRC) and gastric cancer (GC) incidence using Bayesian models and space-time scan statistics in Hamadan Province from 2010 to 2019.
Study Design: An ecological time-series study.
Methods: In this study, the data on CRC and GC cases were obtained from Hamadan cancer registry. The crude standardized incidence ratio (SIR) was calculated for each county per year. Hierarchical Bayesian space-time models were fitted to estimate adjusted SIRs. Space time cluster analysis was performed using space-time scan statistic.
Results: A total of 1864 CRC cases and 2340 GC cases were included in the analyses. The central counties, including Hamadan (smoothed SIR range: 1.24-1.28) and Tuyserkan (1.01-1.24), exhibited higher than expected number of CRC cases. Northern counties such as Razan (1.19-1.51) and Kabudarahang (1.21-1.42), along with Nahavand in the south (0.98, 1.53), also showed higher than expected number of GC cases. The most likely spatiotemporal cluster of CRC was identified in Hamadan and Tuyserkan occurring between 2015 and 2019 (relative risk [RR]=1.82, P<0.001). The most likely spatiotemporal cluster of GC was identified in Nahavand from 2010 to 2011 (RR=1.87, P<0.001).
Conclusion: Spatiotemporal inequality in the incidence of CRC and GC was identified in Hamadan province over the past decade. The findings may help to reduce cancer disparities and allocate effective resources in the appropriate region and time in the future.
Keywords: Bayesian analysis, Colorectal cancer, Gastric cancer, Iran, Mapping, Spatiotemporal
Copyright and License Information
© 2025 The Author(s); Published by Hamadan University of Medical Sciences.
This is an open-access article distributed under the terms of the Creative Commons Attribution License (
https://creativecommons.org/licenses/by/4.0/), which permits unrestricted use, distribution, and reproduction in any medium, provided the original work is properly cited.
Please cite this article as follows: Ayubi E, Niksiar S, Keshtpour Amlashi Z, Talebi-Ghane E. Spatiotemporal mapping of colorectal and gastric cancer incidence in hamadan province, western iran (2010-2019). J Res Health Sci. 2025; 25(2):e00650. doi:10.34172/jrhs.2025.185
Background
Colorectal cancer (CRC) and gastric cancer (GC) are among the most prevalent cancers in both genders in Iran.1-3 Iran has experienced transition in urbanization, population aging, and adoption of Western lifestyle.4-6 The incidence of CRC and GC following ongoing demographic and risk factors transitions has increased in recent years.7,8 CRC and GC are distributed unevenly in Iran over time. Northern and northwestern provinces have higher incidence rates compared to elsewhere.9-12 In other words, the rates of CRC and GC in the northern and northwestern provinces of Iran have similar values and tend to cluster together spatially. In a common sense of spatial epidemiology, identification and assessment of spatial and spatiotemporal clusters in a study space can aid in the monitoring and surveillance of diseases.13 Kulldorff’s spatial scan statistic is one of the well-known and frequently used methods for the identification and analysis of disease clusters in space and time.14-16
Although spatial inequality in the incidence of CRC and GC has been identified at the provincial level in Iran, the cancer rates in smaller geographical units (e.g., county, district) may be different compared with rate at the provincial level, known as ecological fallacy.17,18 Regardless of geographical units, differences in population size can prevent accurate judgment across locations. Through standardization, the burden of outcomes can be compared across locations.19 Another problem that can affect the comparison of rates across locations is space-time autocorrelation in which adjacent and neighboring spatial and temporal units tend to have similar values. The Poisson model is commonly used to analyze rate and count data; however, this model is unable to control the problem of sparse data and space-time autocorrelation effectively. In other words, the predicted variability from the Poisson model may not be the same as the observed reality.20 In such cases, using Bayesian hierarchical models by integrating spatial and temporal random effect components into the conventional models (e.g., Poisson model) can provide robust standardized rates.21,22 Markov Chain Monte Carlo (MCMC) algorithms are common methods for Bayesian inference. Despite their widespread use, MCMC algorithms suffer from problems such as slow convergence, poor chain mixing, and being time-consuming.23 To overcome such problems, a method called integrated nested Laplace approximation (INLA) has been introduced.24 The INLA is computationally efficient and its accuracy competes with the accuracy of the MCMC.2. Given the aforementioned issues, the present study aimed to explore spatiotemporal mapping of CRC and GC incidence using Bayesian models and space-time scan statistics in Hamadan Province from 2010 to 2019.
Materials and Methods
Study area and data sources
This ecological study utilized population registry data on CRC and GC at the county level in Hamadan province from 2010 to 2019. Hamedan province spans an area of 19493 km2 in western Iran, located at coordinates 34.9737° N and 48.5587° E. The province is divided into 9 counties: Hamedan, Malayer, Nahavand, Tuyserkan, Asadabad, Kabudarahang, Razan, Bahar, and Famenin. Hamedan county serves as the provincial capital. Data on the CRC, GC, and also the population size of each county were obtained upon request from the Health Deputy of Hamadan University of Medical Sciences. The cancer registry file included information on age, gender, method of diagnosis (pathology report, death certificate, and clinical diagnosis), ICD code, name of county, and the patient’s residential address. For this study, data related to ICD code 16 for GC and ICD codes 18, 19, and 20 for CRC were used for both genders across each county.
Standardized incidence ratio
The number of observed cases of an outcome (e.g., cancer) in each county (Yi) follows a Poisson distribution,
Yi~Poisson(Ei θi)
Where θi is the relative risk (RR) or standardized incidence ratio (SIR) of the outcome in the county i. For each county i, i = 1,…, n, the SIR is obtained using the following equation:
SIRi = Yi/Ei
Where Ei represents the expected cases, which can be calculated as follows:
Where Yi is the observed number of cases in county i and ni is the population of county i. An SIR greater than 1.00 indicates that the observed number of cancer cases is higher than the expected number.
Spatiotemporal clusters
Space-time scan statistics were applied to identify the most likely spatio-temporal clusters.14-16 The data used for space-time scan statistics include geographic coordinates (latitude and longitude), population at risk, and the observed cases for each county per year. This statistic uses a number of cylinders to detect potential clusters, where the base of the cylinder is circular or elliptical, and its height corresponds to time. The radius and height of the cylinder continuously change as it scans the geographic area and time to identify space-time clusters (e.g., ones with a higher-than-expected number of cases within a geographic region over specified time frames). Cylinders identified through maximum likelihood estimation are considered potential clusters, demonstrating the lowest probability of random occurrence. Assuming that cases within a window follow a Poisson distribution, the log-likelihood ratio (LLR) is defined as follows:
Where c and E[c] represent the number of observed and expected cases in cylinder A, respectively. The C and E[C] represent the total number of observed and expected cases in the study area and time period, respectively. The cylinder with maximum likelihood is the primary cluster. The P value was obtained using Monte Carlo hypothesis testing. Parameters used for space-time cluster analysis were as follow: probability model: discrete Poisson, scanning window: cylinder with a circular base, type of analysis: retrospective space-time, maximum spatial cluster size: default value or 50% of the population at risk, maximum temporal cluster size: default value or 50% of the study period, maximum Monte Carlo permutations: 999, and significance level: pseudo P value < 0.05. The space-time cluster analysis was performed using the SaTScan software version 9.4.2.
Spatiotemporal modeling
It is expected that geographic data units will demonstrate spatial auto-correlation across temporal dimensions.23 It is recommended to include spatial and temporal variability in the standard Poisson model to overcome over-dispersion when estimating the SIR.23 Therefore, we have:
Where α is a constant that represents the overall RR in the study area. The parameter vi represents an unstructured spatial random effect that is an unstructured exchangeable component with prior distribution, which is modeled as an independent and identically distributed normal variable with a mean of zero and variance
. The parameter ui indicates the structured spatial random effect of region i, to account for the spatial dependence between SIRs. The Besag-York-Mollié (BYM) model is the most common model for explaining the structured spatial random effect.25 In this model, ui is induced by a conditional autoregressive (CAR) model, and SIR in region i tends to shrink toward values of the neighboring areas with a common boundary. The CAR model is as follows:
Where nδi is the number of areas that share boundaries with area i.
The parameter γj represents the structured temporal effect that can be modeled using random walk.23 The random walk model effectively captures changes in time series data in a gradual and continuous manner. This model assumes that changes at each time point depend solely on the previous state, thereby reducing computational complexity and facilitating analysis.23 For example, random walk in time of second order (RW2) is:
The Φj is unstructured temporal effect,
It is expected that the areas will have their own specific temporal patterns while also exhibiting spatial dependence on neighboring areas, a space-time interaction. The classical parametric model to take into account is as follows:
Where β denotes the main linear time trend that represents the global time effect, and δi denotes a space-time interaction. Another suggested model for accounting for space-time interaction is non-parametric models, as follows:
Where δij is the interaction term. Four types of interactions have been proposed,21 type I (vi, Φj), type II (vi,γj), type III (ui,Φj), and type IV (ui,γj). These interaction terms explain the variations in time trends across different areas and can help account for differences in cancer trends among various counties.21
In this study, 6 Bayesian models were used to explore the spatiotemporal mapping of CRC and GC incidence. The following assumptions were considered: independent and identically distributed (i.i.d) Gaussian prior to unstructured spatial (vi), independent and identically distributed (i.i.d) Gaussian prior for temporal effect (Φj), CAR prior to structured spatial effect (ui), and second (RW2) order random walk prior to structured temporal effect (γj). The distribution of hyper-parameters σ, of spatial and temporal random effects was specified using the default specification of R-INLA. The spatial adjacency matrix was defined using the queen contiguity criterion. The posterior estimate (mean) of SIRs adjusted for effects of space, time, and space-time interaction were obtained using INLA approach24 in R 4.1.3 software. The deviance information criterion (DIC), Watanabe-Akaike information criterion (WAIC),26,27 the Σlog conditional predictive ordinate (Σlog CPO), probability integral transform (PIT),28 and R2 value were the criteria to select the best-fitting model. According to the rule of thumb, the best-fitted model is the one with lower values of DIC and WAIC and a higher value of Σlog CPO and R2 compared to other models. Additionally, the PIT values should have a more or less uniform distribution, and the uniformity was tested using the Anderson-Darling test.
Results
A total of 1864 cases of CRC and 2340 cases of GC were included in the analysis. The overall incidence rate of CRC was 107.72 per 100 000, and the overall incidence rate of GC was 135.23 per 100 000 people from 2010 to 2019. The crude SIRs of CRC and GC from 2010 to 2019 are illustrated in Figures 1 and 2. Over the decade, a disparity in CRC incidence was observed in Hamadan province, where northern and southern counties reported lower than expected rates. In contrast, central counties such as Hamadan and Tuyserkan exhibited higher than expected number of cases. For instance, in 2019, the crude SIR of CRC in Hamadan county was 1.44 (observed = 150, expected = 104), and it was 1.08 (observed = 19, expected = 17) in Tuyserkan. Additionally, the lowest crude SIR of 0.48 was reported for Nahavand county (observed = 15, expected = 31) in 2019 (Figure 1). There has been a spatial inequality in the incidence of GC in Hamadan province over the past decade, with Razan and Kabudarahang in the north and Nahavand in the south showing higher than the expected number of cases. In contrast, the central counties reported observed cases equal to or below expected levels. In Razan and Kabudarahang, the number of observed cases exceeded expectations in most of the years. For example, the observed number of GC cases in these two counties was about 35% higher than the expected number of cases (SIR = 1.35) in 2019. Recently, there has been a gradual increase in the trend in Nahavand county as well, with the SIR in Nahavand being 1.14 in 2018 and 2019 (Figure 2).
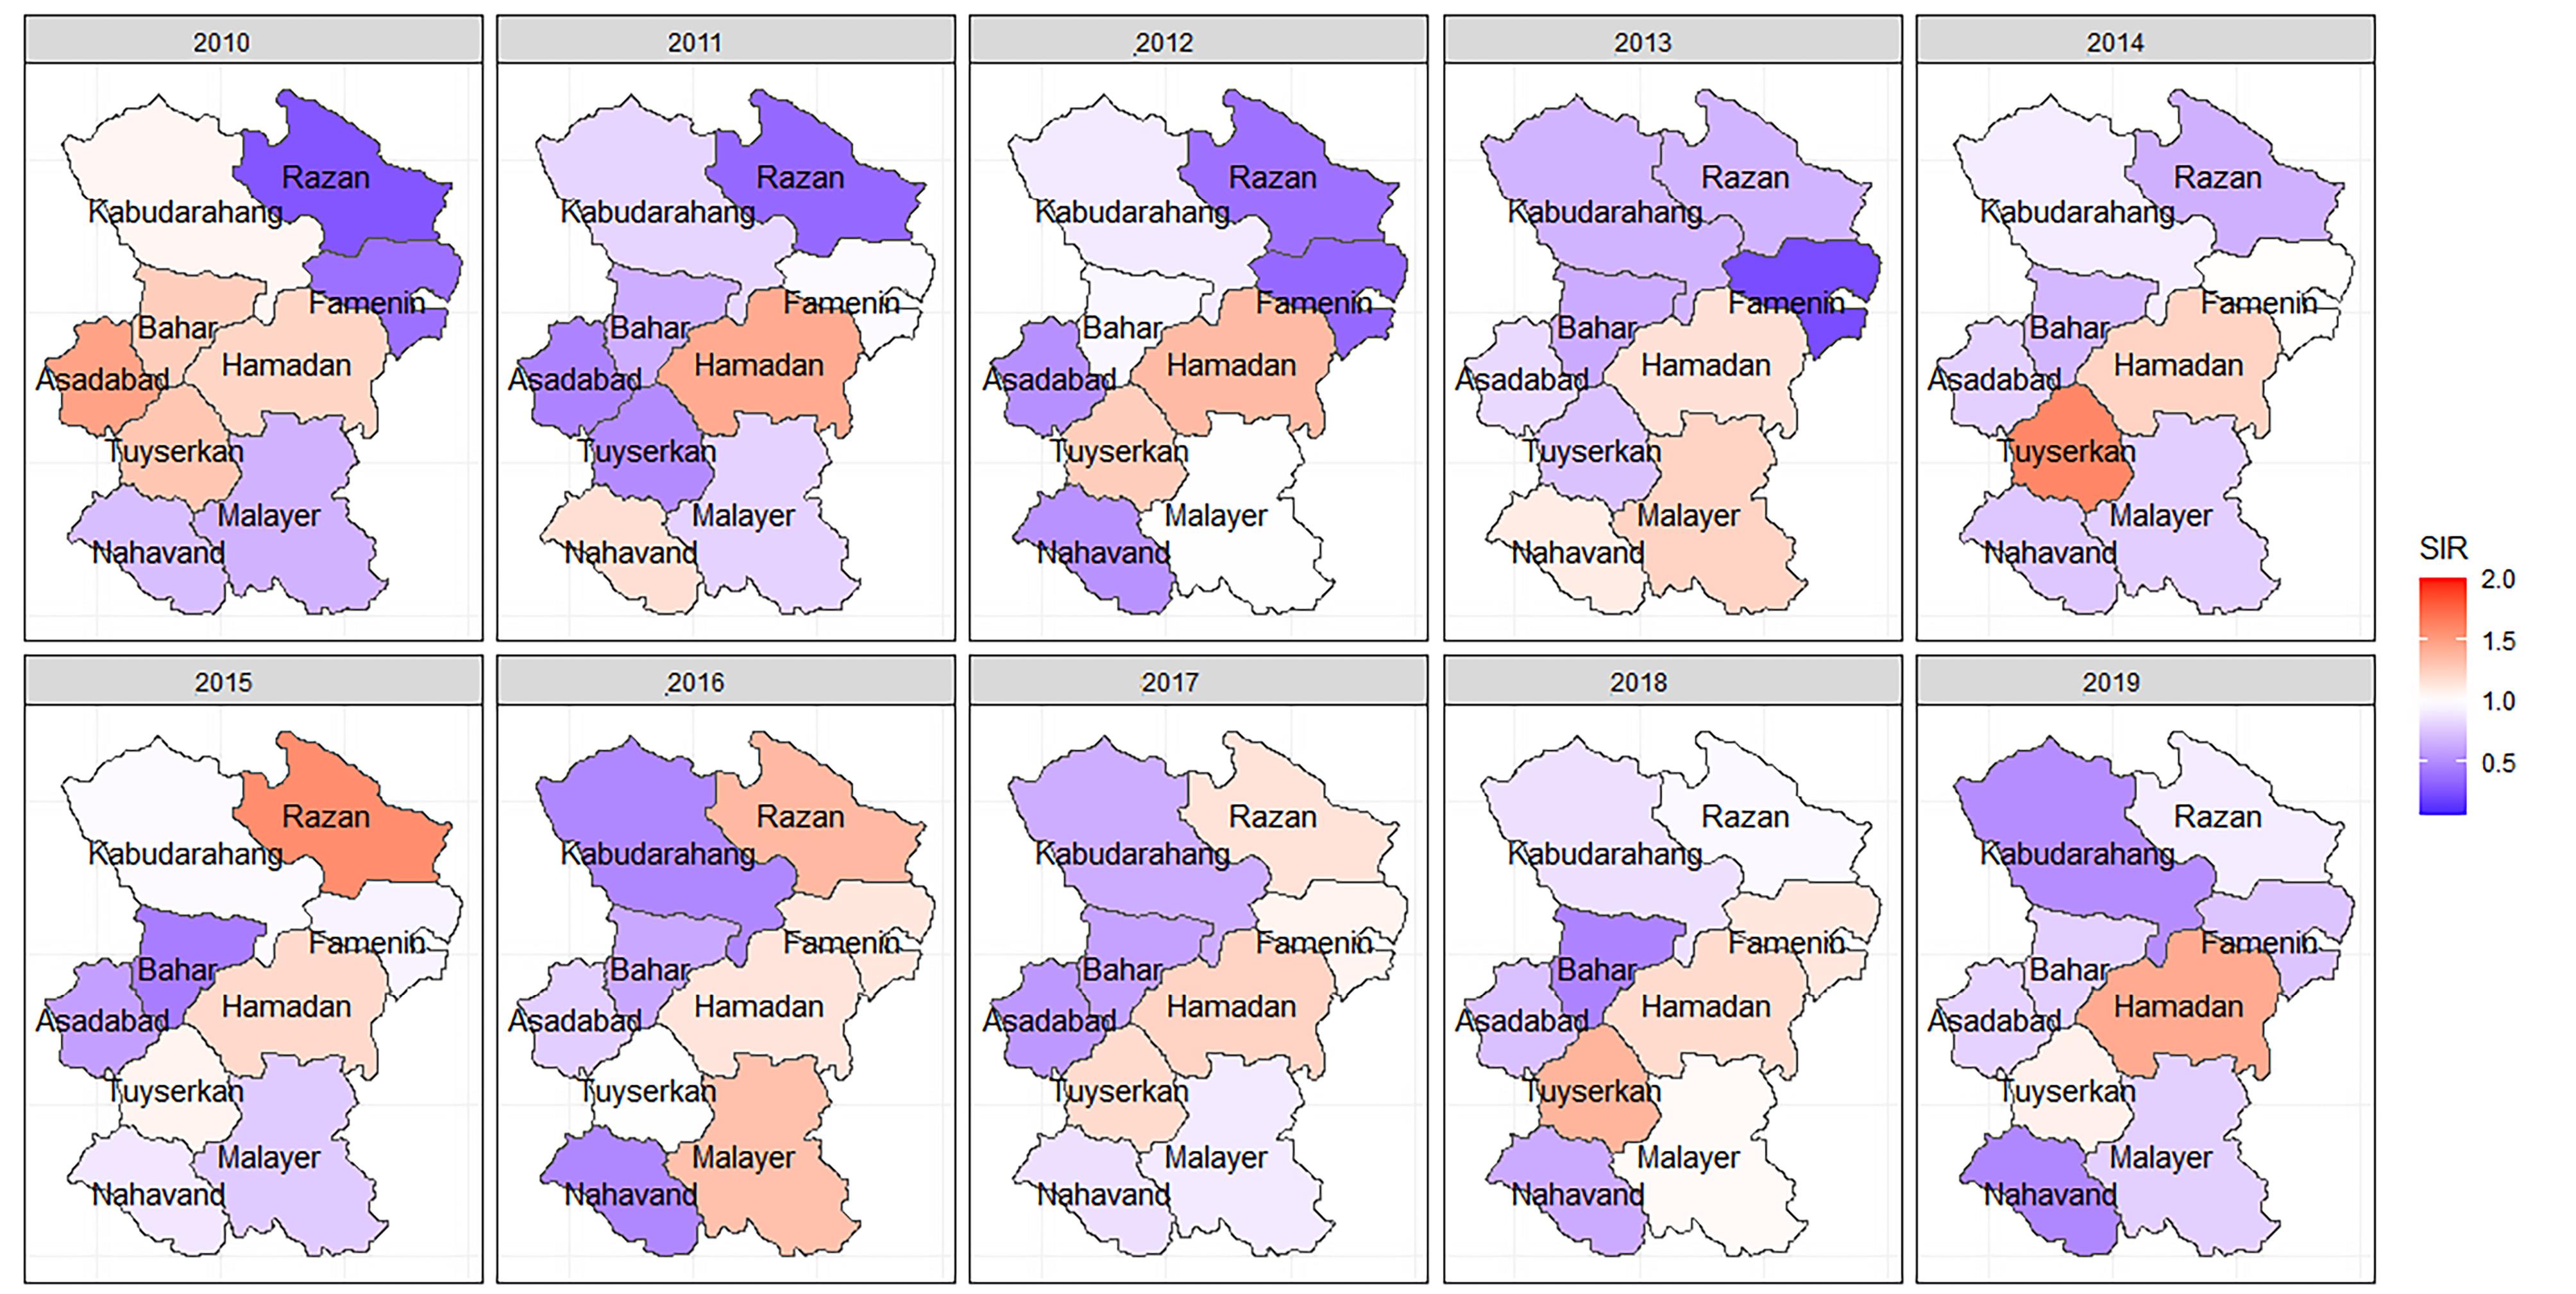
Figure 1.
The spatiotemporal mapping of the crude standardized incidence rate of colorectal cancer in Hamadan province during 2010-2019. SIR: Standardized incidence ratio
.
The spatiotemporal mapping of the crude standardized incidence rate of colorectal cancer in Hamadan province during 2010-2019. SIR: Standardized incidence ratio
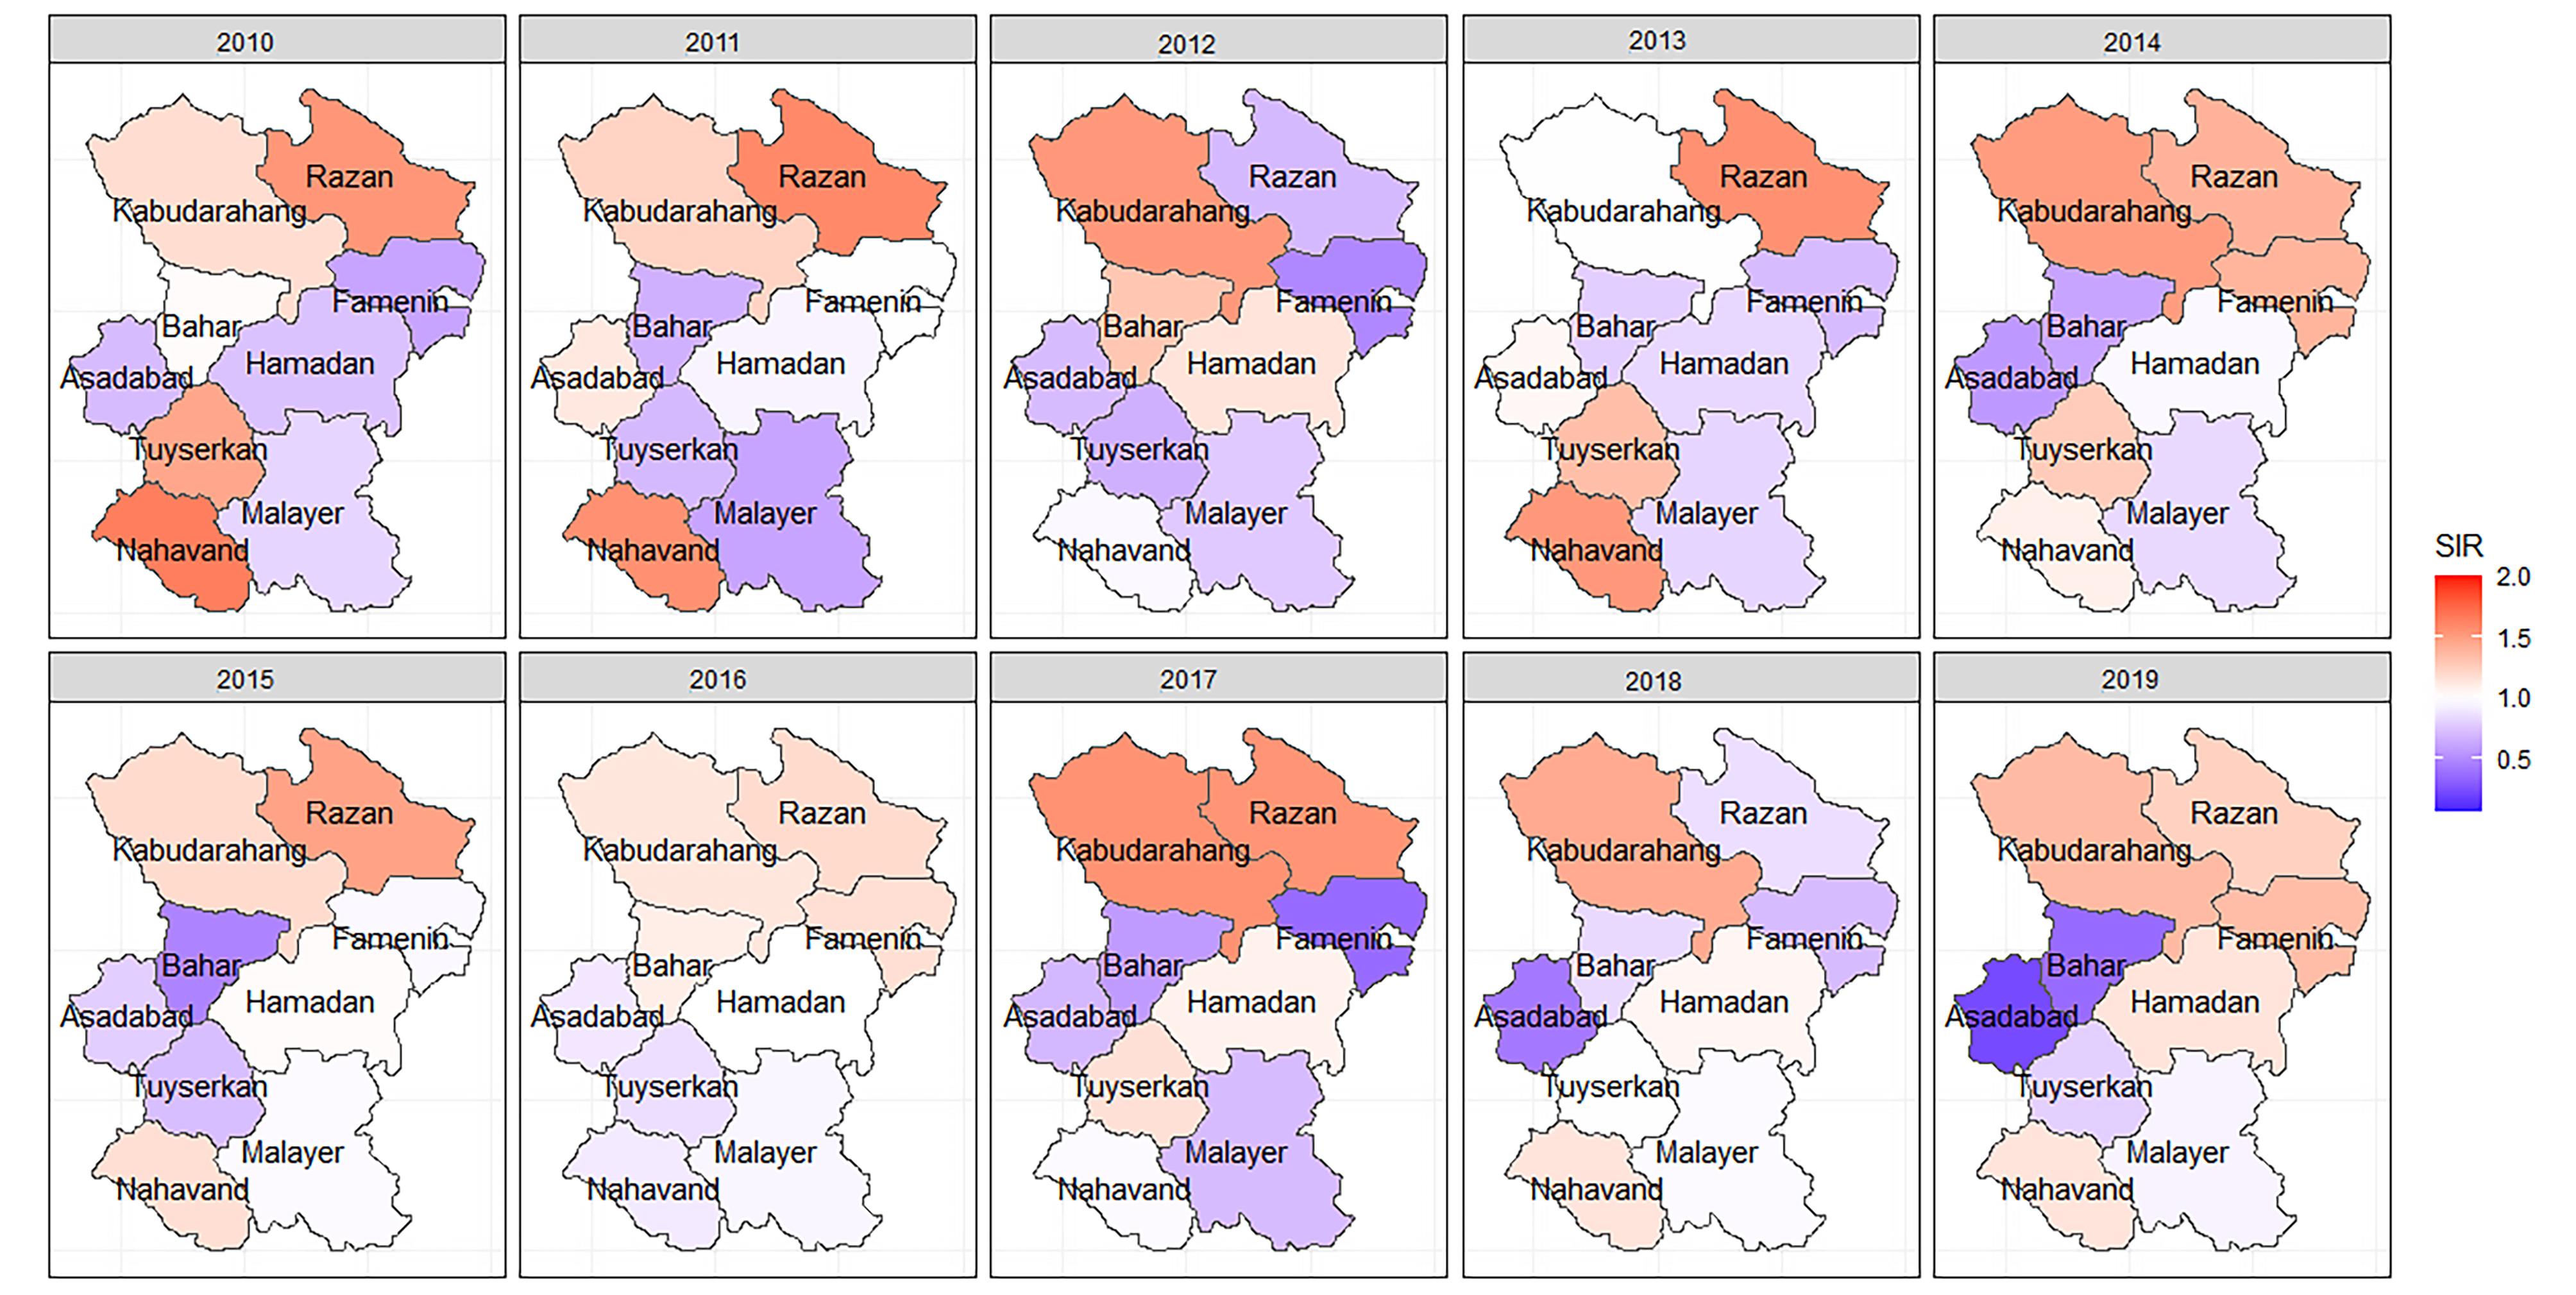
Figure 2.
The spatiotemporal mapping of the crude standardized incidence rate of gastric cancer in Hamadan province during 2010-2019, SIR: Standardized incidence ratio
.
The spatiotemporal mapping of the crude standardized incidence rate of gastric cancer in Hamadan province during 2010-2019, SIR: Standardized incidence ratio
The space-time scan statistics identified one significant low-risk cluster and one high-risk cluster of CRC during 2010-2019. The low-risk cluster was identified between 2010 and 2014, encompassing Kabudarahang, Famenin, Razan, and Bahar counties. During this period, people in these 4 counties had a 49% lower risk of CRC compared to other areas (RR = 0.51(. In 2015-2019, 394 CRC cases were expected to occur in Hamadan and Tuyserkan counties, but 610 cases were observed (RR = 1.82). For GC, two significant high-risk clusters were identified in 2010-2011. The most likely low-risk cluster was identified in 2015-2019, including Bahar and Asadabad counties in which the risk of GC among residents of these two counties was 37% lower compared to other areas (Table 1).
Table 1.
The space-time clusters of colorectal and gastric cancers in Hamadan province during 2010-2019
|
Cancer
|
County included
|
Time
|
Population
|
Observed
|
Expected
|
O/E
|
RR
|
logLR
|
P
value
|
| Colorectal |
|
|
|
|
|
|
|
|
|
| Primary low rate cluster |
Kabudarahang, Famenin, Razan, Bahar |
2010-2014 |
410004 |
118 |
218.63 |
0.54 |
0.51 |
30.88 |
0.001 |
| Primary high rate cluster |
Tuyserkan, Hamadan |
2015-2019 |
766614 |
610 |
393.62 |
1.55 |
1.82 |
67.61 |
0.001 |
| Gastric |
|
|
|
|
|
|
|
|
|
| Primary low rate cluster |
Asadabad, Bahar |
2015-2019 |
238236 |
98 |
152.33 |
0.64 |
0.63 |
11.77 |
0.001 |
| Secondary low rate cluster |
Malayer |
2011-2014 |
299070 |
113 |
160.23 |
0.71 |
0.69 |
8.27 |
0.030 |
| Primary high rate cluster |
Nahavand |
2010-2011 |
193745 |
96 |
52.21 |
1.84 |
1.87 |
15.10 |
0.001 |
| Secondary high rate cluster |
Famenin, Kabudarahang, Razan |
2010-2011 |
285358 |
114 |
77.19 |
1.48 |
1.50 |
7.94 |
0.040 |
RR: relative risk, logLR: log likelihood ratio
Table 2 presents the results of goodness of fit statistics for 6 Bayesian models. It can be inferred that parametric model and non-parametric models including type II and type IV interaction structures fit better on the dataset compared with other models. Nonetheless, type II and type IV interaction structures explain 53% and 46% of the variability in the SIR of CRC and GC, respectively. The CPO and PIT values obtained from type IV interaction structure are depicted in Figure 3. The PIT values exhibit a uniform distribution, and also observations with CPO values different from others are more or less unlikely. The Anderson-Darling test also confirmed the null hypothesis of uniform distribution of type IV interaction structure to model CRC (test statistic = 0.88, P = 0.42) and GC (test statistic = 0.68, P = 0.57).
Table 2.
Goodness of fit and performance statistics of six Bayesian Models to assess space-time pattern of colorectal and gastric cancer in Hamadan province during 2010-2019
|
Model
|
Colorectal cancer
|
Gastric cancer
|
|
DIC
|
WAIC
|
SumLog(CPO)
|
R2
|
DIC
|
WAIC
|
SumLog(CPO)
|
R2
|
| Non-parametric model, no time-space interaction |
502.09 |
503.75 |
-252.06 |
0.28 |
546.27 |
549.44 |
-274.91 |
0.42 |
| Non-parametric model, time-space interaction (Type I) |
502.19 |
503.75 |
-252.08 |
0.28 |
546.21 |
549.42 |
-274.92 |
0.42 |
| Non-parametric model, time-space interaction (Type II) |
502.41 |
505.47 |
-254.60 |
0.46 |
534.57 |
534.08 |
-268.09 |
0.53 |
| Non-parametric model, time-space interaction (Type III) |
517.00 |
521.55 |
-262.64 |
0.28 |
560.34 |
567.63 |
-285.44 |
0.42 |
| Non-parametric model, time-space interaction (Type IV) |
502.13 |
505.10 |
-254.44 |
0.46 |
535.15 |
534.76 |
-268.49 |
0.53 |
| Parametric model |
502.87 |
504.51 |
-252.55 |
0.29 |
534.44 |
535.93 |
-268.18 |
0.46 |
DIC: deviance information criterion, WAIC: Watanabe-Akaike information criterion, CPO: Conditional Predictive Ordinate, R2: r-squared
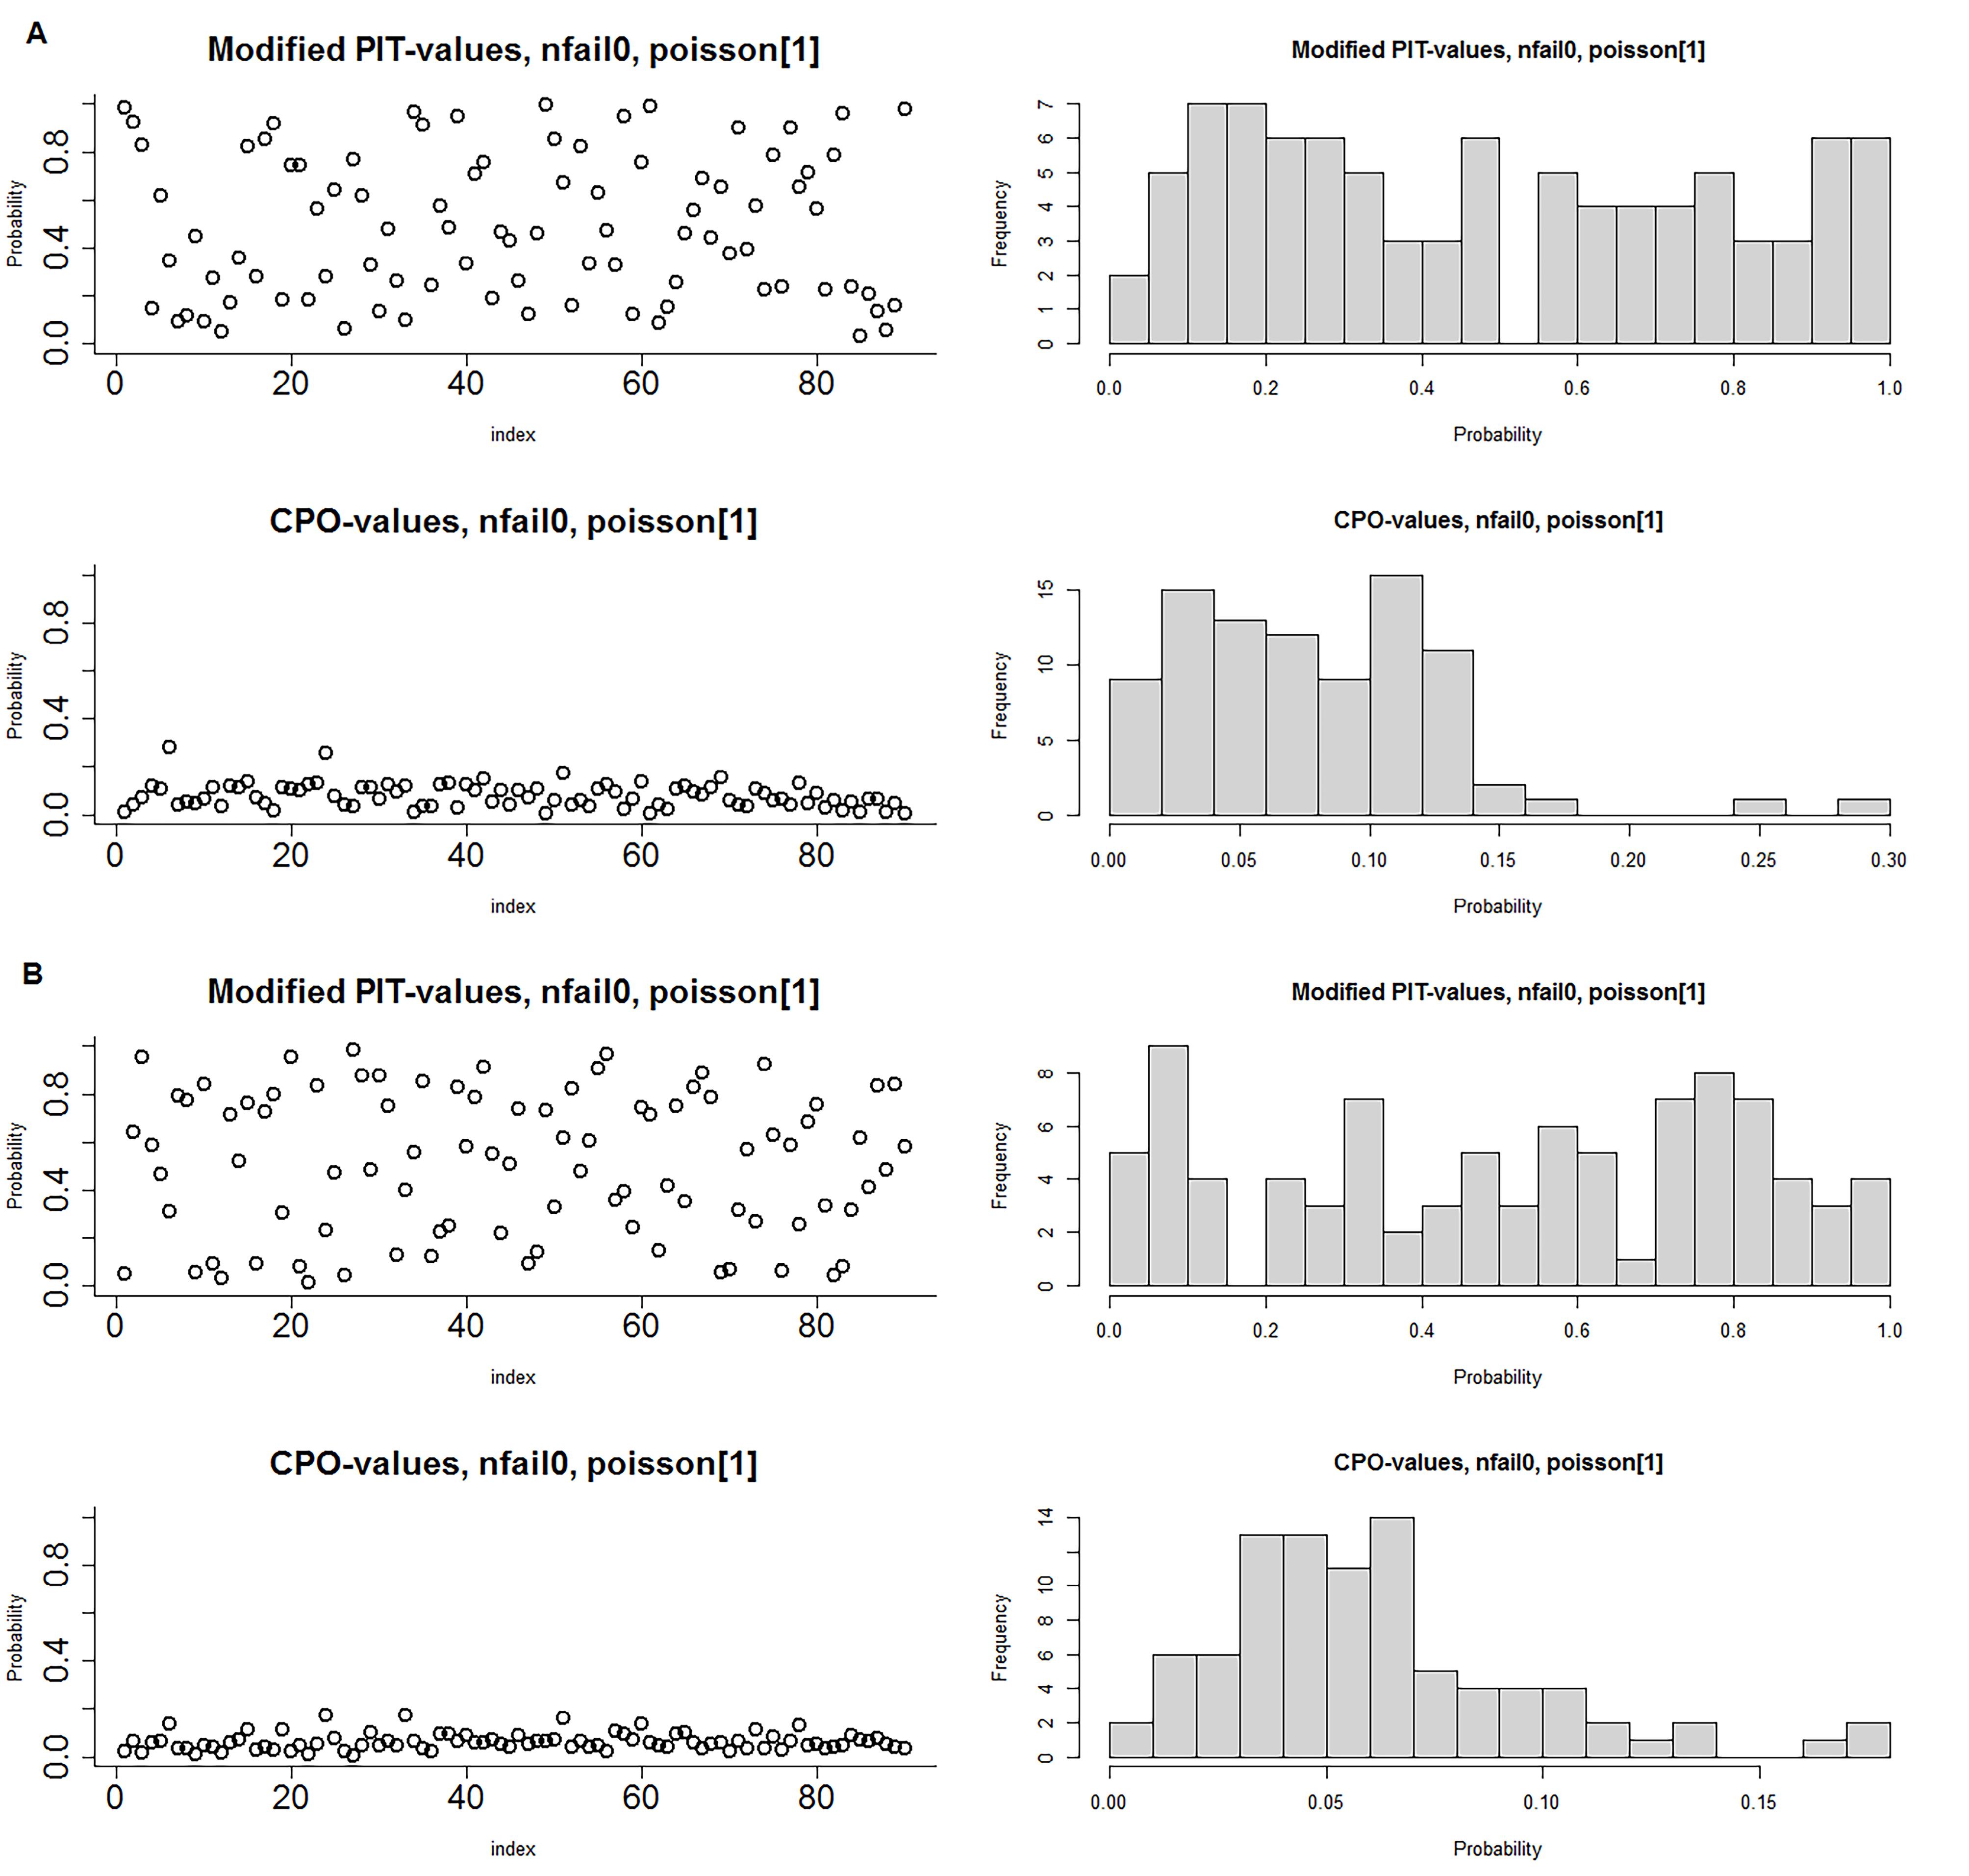
Figure 3.
Conditional predictive ordinate (CPO) and probability integral transform (PIT) distribution of type IV space-time interaction structure; A) Colorectal cancer, B) Gastric cancer
.
Conditional predictive ordinate (CPO) and probability integral transform (PIT) distribution of type IV space-time interaction structure; A) Colorectal cancer, B) Gastric cancer
The adjusted SIRs stratified by county and year are presented in Figure 4. Over time, the SIR of CRC and GC in the counties underwent changes after adjusting for space, time, and their interaction. The adjusted SIRs of CRC for Hamadan and Tuyserkan were greater than 1.00, fluctuated in all years, and had a gradual increase from 2010 to 2019. This increase was more pronounced in Tuyserkan. These counties had the highest rate of CRC with values of 1.28 and 1.24 in 2019. The SIRs in Razan and Famenin increased so sharply from 2010 until 2019 that adjusted SIRs in both counties exceeded 1 after 2017 and reached 1.27 and 1.10 in 2019, respectively. In other counties, the adjusted SIRs of CRC were below 1.00 during the study years. Malayer had a consistent trend of SIRs during a decade while the other counties had a gradual downward trend until 2019. Bahar and Nahavand had the lowest SIRs in 2019 with a value of 0.59 in both counties (Figure 4A).
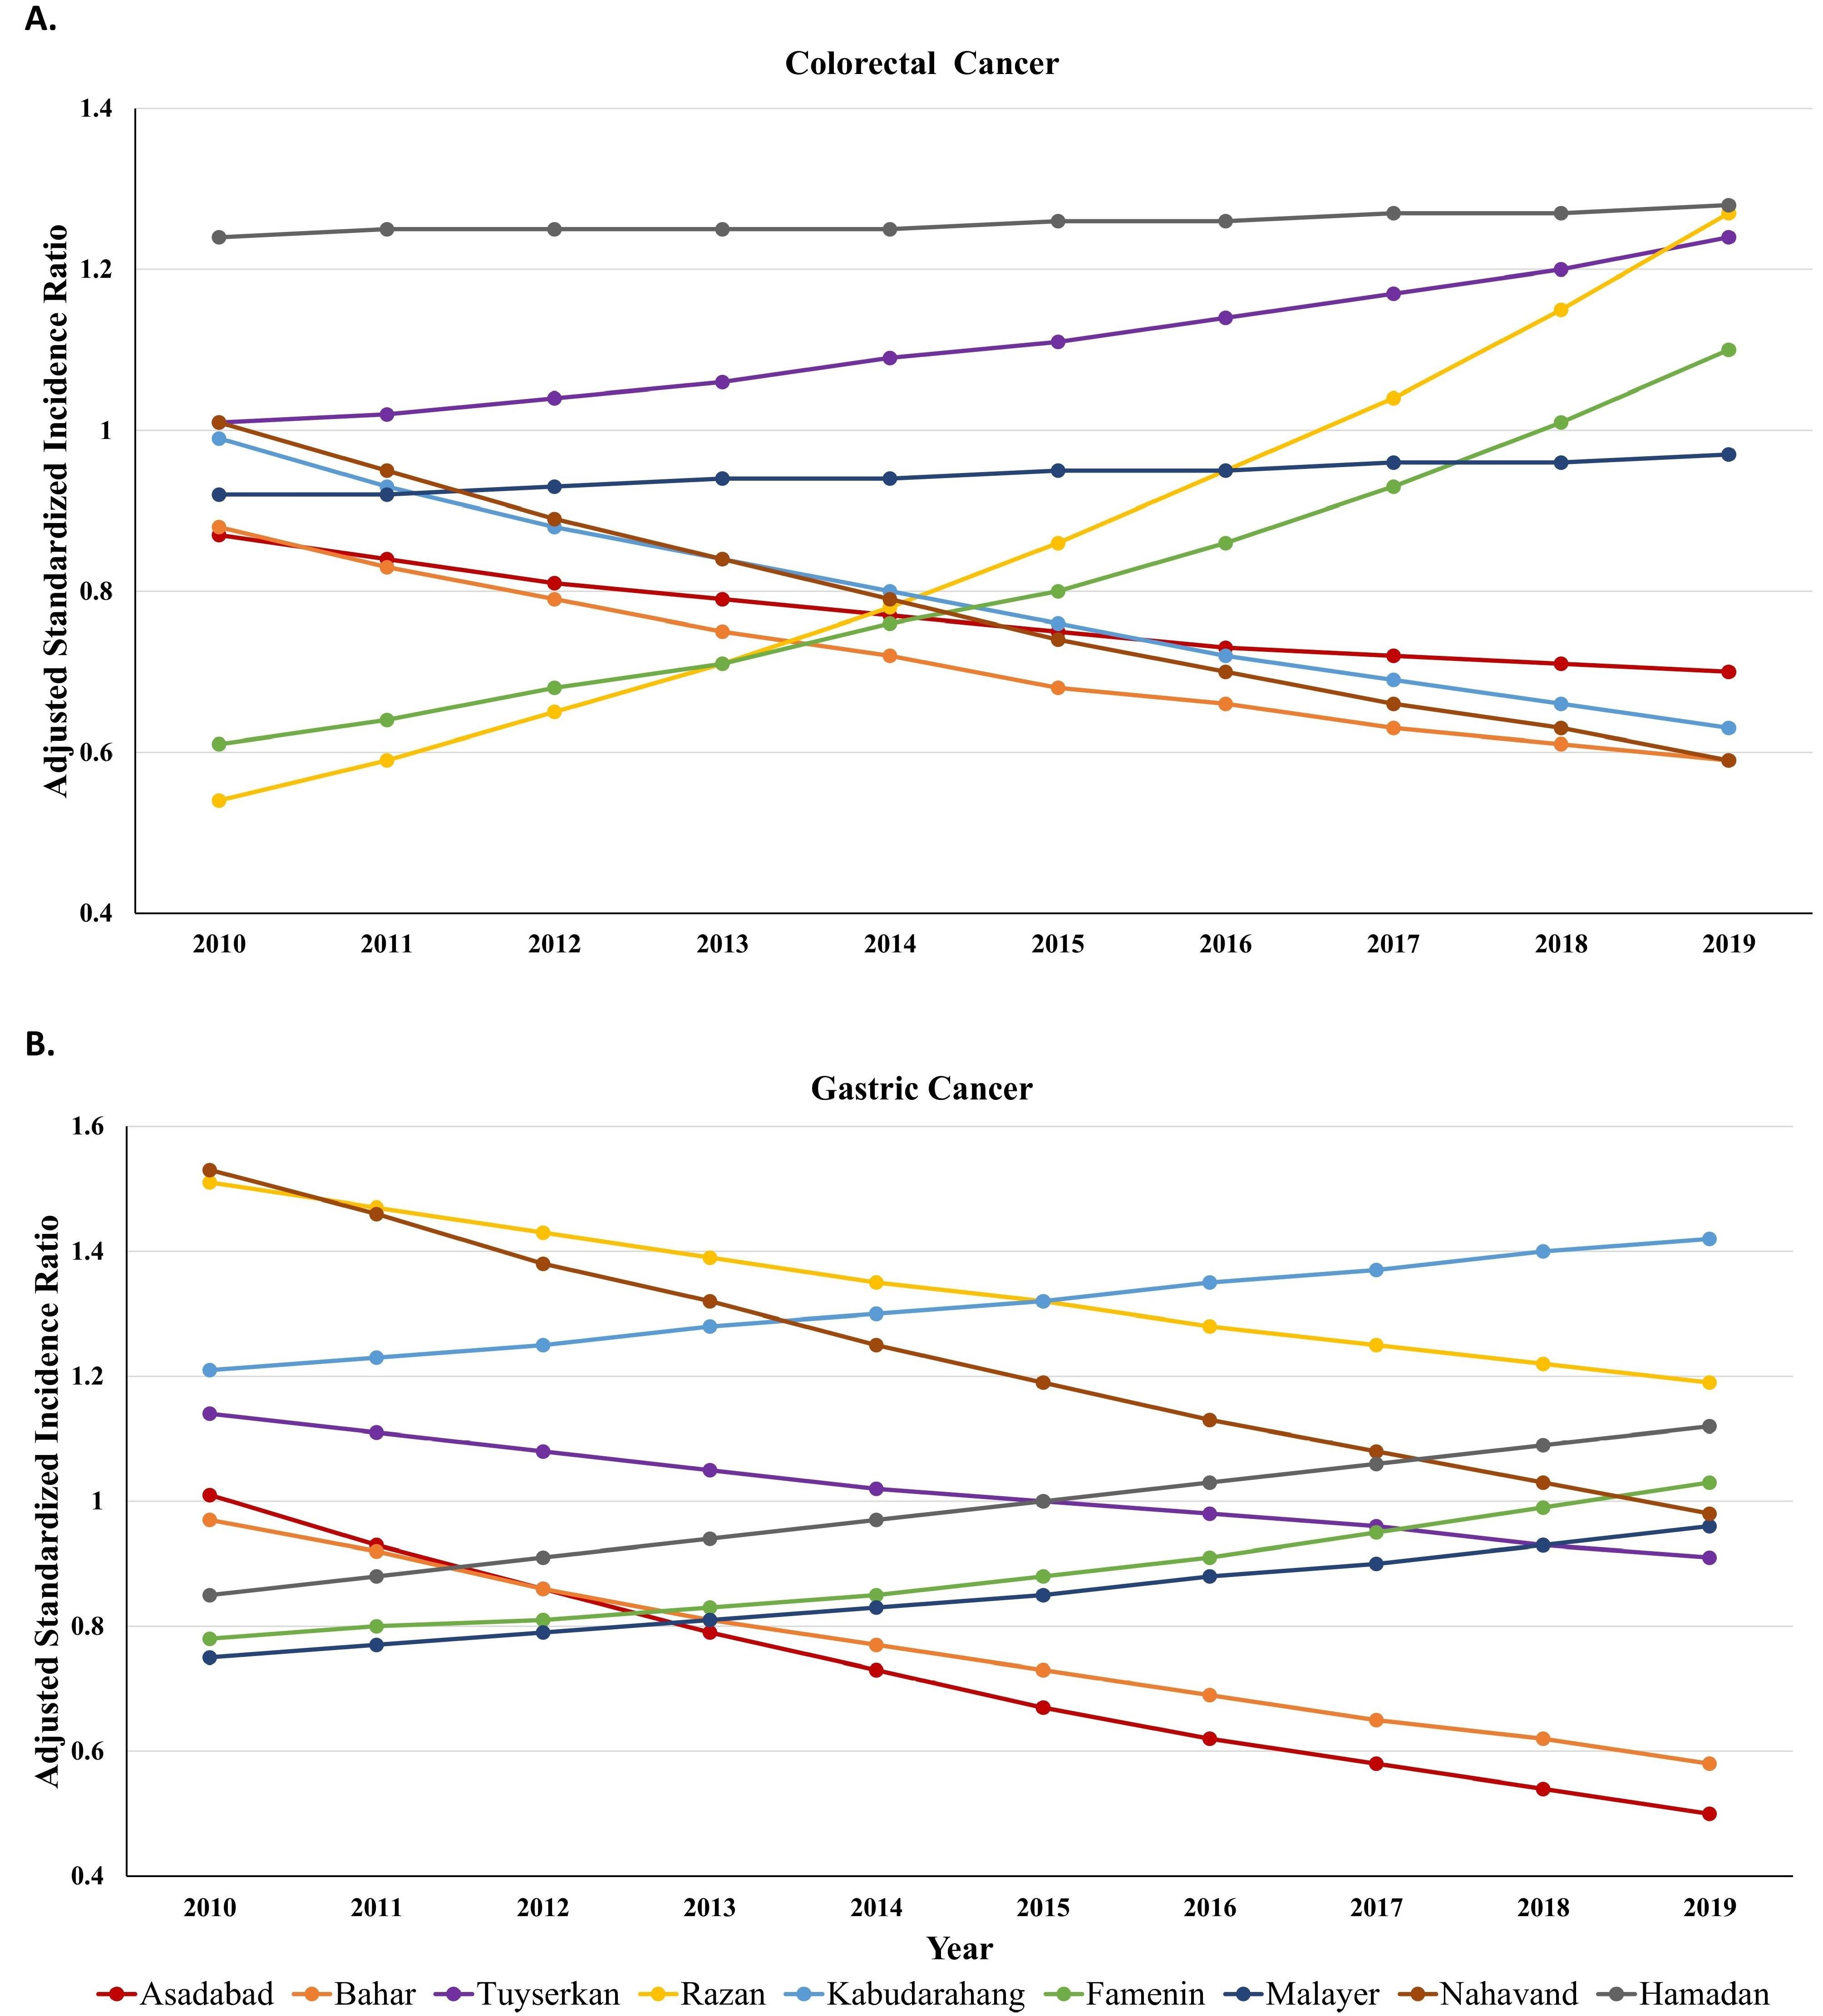
Figure 4.
Smoothed standardized incidence ratio of colorectal (A) and gastric (B) cancer trend in Hamadan province during 2010-2019 based on type IV
.
Smoothed standardized incidence ratio of colorectal (A) and gastric (B) cancer trend in Hamadan province during 2010-2019 based on type IV
The trends in Figure 4B demonstrated that the adjusted SIRs of GC for Razan, Nahavand, and Kabudarahang were greater than 1 from 2010 to 2019. The trend for the two first counties was downward and it was upward for the third county over time. As observed, the highest SIRs in 2010 were 1.53 and 1.51 for Razan and Nahavand and in 2019 and they were 1.42 and 1.19 for Kabudarahang and Razan. Hamadan and Tuyserkan had completely opposite trends. While the adjusted SIR for Hamadan was less than 1 (0.85) in 2010, it increased continuously from 2010 to 2019 and peaked in 2019 (1.12), the adjusted SIR for Tuyserkan was greater than 1 (1.14) in 2010, declined continuously from 2010 to 2019 and was the lowest in 2019 (0.91). In other counties, the adjusted SIRs of GC were below 1 during a decade. Although Asadabad and Bahar had a gradual downward trend until 2019, Famenin and Malayer had a gradual upward trend of SIRs during the decade. Furthermore, Bahar and Asadabad had the lowest SIRs in 2019 with values of 0.58 and 0.50, respectively (Figure 4B).
Discussion
Spatiotemporal models can be used to develop disease distribution maps which are essential to allocate effective resources in the appropriate region and time. The present study enhanced the mapping knowledge of CRC and GC in all counties of Hamadan province over a decade (2010-2019) by employing spatiotemporal Bayesian models and space-time scan statistics. Spatiotemporal inequality in the incidence of CRC and GC was identified, with several significant high-risk and low-risk clusters emerging over time. The central counties of the province exhibited a higher risk of CRC, while the northern and southern counties showed a higher risk of GC.
The results of the models used in this study demonstrated that the incorporation of temporal and spatial random components along with their interactions into the conventional model (e.g., the Poisson model) improved the performance of mapping. Moreover, to overcome the limited number of cancer cases in some counties which led to sparse data, the Bayesian models were executed using the INLA method without encountering convergence problems. The effectiveness of the INLA method was confirmed in other studies even in cancer datasets with zero-inflation.29 Among the developed Bayesian models, the non-parametric models of types II and IV exhibited superior performance compared to the others. Based on model selection criteria (e.g., DIC, WAIC, and CPO), there was only a slight difference between type II and IV models. The analyses highlighted that the cancer incidence rate in a geographic unit tends to shrink toward the incidence rate of neighboring locations and temporal units. The results of the present study, which are similar to previous studies conducted in Iran, indicated that considering spatial and temporal variability for the mapping of cancer is preferable.29-31
Our study results showed that the incidence of CRC is more concentrated in the counties located in the center of the province, while the border counties have lower rates. The findings are consistent with a previous geospatial analysis of CRC in Hamadan province from 2007 to 2014.32 In the aforementioned study, the spatial unit was district level and the hot spot clusters were identified in the center of the province, while the significant cold spot clusters were identified in the north and northeast.32 The higher risk of CRC in Hamadan county may be attributed to the impact of socioeconomic status (SES). Hamadan county is the capital of Hamadan province, where SES is higher compared to other counties. Higher SES can result in greater health awareness, leading to increased utilization and adherence to CRC screening guidelines.33,34
The high incidence of GC in the northern and southern counties might result from differences in genetic background and exposure to environmental factors such as Helicobacter pylori infection, unhealthy diet (e.g., sodium and salted foods), and soil and water pollutants (e.g., heavy metal and chemical composition). The border counties of Hamadan province have a lower SES compared to the counties located in the center of the province. Low socioeconomic conditions, along with poor hygiene and sanitation, predispose individuals to acquire H. pylori infection.35,36 Previous studies have suggested that the concentration of nitrate in water resources in areas close to the north and south of Hamadan province was higher than in other locations.37,38 A study has also suggested a direct relationship between the level of nitrate and lead in water and GC in Hamadan province.39
Several limitations should be acknowledged. First, the results in smaller geographic units, such as census tracts, can differ from those at larger levels, like counties (ecological fallacy). Furthermore, spatial analysis relies on the way boundaries are defined and the methods employed for data aggregation, which highlighting the modifiable areal unit problem. Second, the current study presents a univariate spatiotemporal model; however, some variables such as the SES of counties can affect the spatiotemporal mapping of CRC and GC. It is expected that incorporating exploratory variables into the model design will enhance its predictive power, leading to higher R2 values. Third, geocoding was not possible for some cancer cases because the county name was not specified; they were only recorded as cancer cases in Hamadan province. Finally, we defined random effects and hyperparameters using commonly used prior distributions and default choices. However, testing different priors and evaluating their effects on model predictions can help ensure optimal results.
Highlights
-
Hierarchical Bayesian space-time models can provide new insights into spatiotemporal mapping of cancers.
-
The Bayesian models provide evidence for spatial disparity in colorectal cancer (CRC) and gastric cancer (GC) in Hamadan province from 2010 to 2019.
-
The central counties exhibited a higher risk of CRC.
-
The northern and southern counties showed a higher risk of GC.
Conclusion
In this study, Bayesian hierarchical methods and space-time scan statistics were used for spatiotemporal mapping of CRC and GC incidence in Hamadan province from 2010 to 2019. The analyses highlighted the presence of spatiotemporal disparity in the incidence of CRC and GC, where CRC was more concentrated in the counties located in the center of the province and GC was predominantly found in the northern and southern regions. Future studies should focus on the mapping of these two cancers in smaller geographic units, incorporating various prior types for spatial and temporal random components, to enhance insights into the spatiotemporal mapping of CRC and GC.
Acknowledgments
The authors would like to thank the Vice-Chancellor of Health of Hamadan University of Medical Sciences for providing the data and the Vice-Chancellor of Research of Hamadan University of Medical Sciences for supporting this research.
Competing Interests
The authors declare no competing interests.
Ethical Approval
The study was approved by the Research Ethics Committee of the Hamadan University of Medical Sciences (IR.UMSHA.REC.1403.539).
Funding
The present study was supported by Hamadan University of Medical Sciences, Hamadan, Iran (Research ID: 140308016665).
References
- Azizikia H, Teymourzadeh A, Kouchaki H, Nakhostin-Ansari A, Jafari Doudaran P, Ahmadinejad I. Colorectal cancer incidence in Iran based on sex, age, and geographical regions: a study of 2014-2017 and projected rates to 2025. Arch Iran Med 2024; 27(4):174-82. doi: 10.34172/aim.2024.26 [Crossref] [ Google Scholar]
- Faramarzi S, Kiani B, Faramarzi S, Firouraghi N. Cancer patterns in Iran: a gender-specific spatial modelling of cancer incidence during 2014-2017. BMC Cancer 2024; 24(1):191. doi: 10.1186/s12885-024-11940-4 [Crossref] [ Google Scholar]
- Mohammadi E, Aminorroaya A, Fattahi N, Azadnajafabad S, Rezaei N, Farzi Y. Epidemiologic pattern of cancers in Iran; current knowledge and future perspective. J Diabetes Metab Disord 2021; 20(1):825-9. doi: 10.1007/s40200-020-00654-6 [Crossref] [ Google Scholar]
- Pilehvar AA. Spatial-geographical analysis of urbanization in Iran. Humanit Soc Sci Commun 2021; 8(1):63. doi: 10.1057/s41599-021-00741-w [Crossref] [ Google Scholar]
- Danaei G, Farzadfar F, Kelishadi R, Rashidian A, Rouhani OM, Ahmadnia S. Iran in transition. Lancet 2019; 393(10184):1984-2005. doi: 10.1016/s0140-6736(18)33197-0 [Crossref] [ Google Scholar]
- Doshmangir L, Khabiri R, Gordeev VS. Policies to address the impact of an ageing population in Iran. Lancet 2023; 401(10382):1078. doi: 10.1016/s0140-6736(23)00179-4 [Crossref] [ Google Scholar]
- Ghasemi-Kebria F, Jafari-Delouie N, Semnani S, Fazel A, Etemadi A, Norouzi A. Colorectal cancer incidence trends in Golestan, Iran: an age-period-cohort analysis 2004-2018. Cancer Epidemiol 2023; 86:102415. doi: 10.1016/j.canep.2023.102415 [Crossref] [ Google Scholar]
- Khosravi Shadmani F, Farzadfar F, Yoosefi M, Mansori K, Khosravi Shadman R, Haghdoost A. Premature mortality of gastrointestinal cancer in Iran: trends and projections 2001-2030. BMC Cancer 2020; 20(1):752. doi: 10.1186/s12885-020-07132-5 [Crossref] [ Google Scholar]
- Asgarian FS, Mahdian M, Amori N. Epidemiology and trends of gastrointestinal cancer in Iran (2004-2008). J Cancer Res Ther 2021; 17(4):963-8. doi: 10.4103/jcrt.JCRT_509_19 [Crossref] [ Google Scholar]
- Jenabi E, Saatchi M, Khazaei S, Mansori K, Ayubi E, Soheylizad M. National distribution of stomach cancer incidence in Iran: a population-based study. Adv Hum Biol 2019; 9(1):89-93. doi: 10.4103/aihb.Aihb_37_18 [Crossref] [ Google Scholar]
- Khosravi Shadmani F, Ayubi E, Khazaei S, Sani M, Mansouri Hanis S, Khazaei S. Geographic distribution of the incidence of colorectal cancer in Iran: a population-based study. Epidemiol Health 2017; 39:e2017020. doi: 10.4178/epih.e2017020 [Crossref] [ Google Scholar]
- Pakzad R, Khani Y, Pakzad I, Momenimovahed Z, Mohammadian-Hashejani A, Salehiniya H. Spatial analysis of stomach cancer incidence in Iran. Asian Pac J Cancer Prev 2016; 17(S3):27-32. doi: 10.7314/apjcp.2016.17.s3.27 [Crossref] [ Google Scholar]
- Kirby RS, Delmelle E, Eberth JM. Advances in spatial epidemiology and geographic information systems. Ann Epidemiol 2017; 27(1):1-9. doi: 10.1016/j.annepidem.2016.12.001 [Crossref] [ Google Scholar]
- Kulldorff M. A spatial scan statistic. Commun Stat Theory Methods 1997; 26(6):1481-96. doi: 10.1080/03610929708831995 [Crossref] [ Google Scholar]
- Kulldorff M. Prospective time periodic geographical disease surveillance using a scan statistic. J R Stat Soc Ser A Stat Soc 2001; 164(1):61-72. doi: 10.1111/1467-985x.00186 [Crossref] [ Google Scholar]
- Kulldorff M, Huang L, Pickle L, Duczmal L. An elliptic spatial scan statistic. Stat Med 2006; 25(22):3929-43. doi: 10.1002/sim.2490 [Crossref] [ Google Scholar]
- Ayubi E, Mansournia MA, Ghanbari Motlagh A, Mosavi-Jarrahi A, Hosseini A, Yazdani K. Exploring neighborhood inequality in female breast cancer incidence in Tehran using Bayesian spatial models and a spatial scan statistic. Epidemiol Health 2017; 39:e2017021. doi: 10.4178/epih.e2017021 [Crossref] [ Google Scholar]
- Lokar K, Zagar T, Zadnik V. Estimation of the ecological fallacy in the geographical analysis of the association of socio-economic deprivation and cancer incidence. Int J Environ Res Public Health 2019; 16(3):296. doi: 10.3390/ijerph16030296 [Crossref] [ Google Scholar]
- Jafari-Koshki T, Schmid VJ, Mahaki B. Trends of breast cancer incidence in Iran during 2004-2008: a Bayesian space-time model. Asian Pac J Cancer Prev 2014; 15(4):1557-61. doi: 10.7314/apjcp.2014.15.4.1557 [Crossref] [ Google Scholar]
- Bilancia M, Fedespina A. Geographical clustering of lung cancer in the province of Lecce, Italy: 1992-2001. Int J Health Geogr 2009; 8:40. doi: 10.1186/1476-072x-8-40 [Crossref] [ Google Scholar]
- Knorr-Held L. Bayesian modelling of inseparable space-time variation in disease risk. Stat Med 2000; 19(17-18):2555-67. doi: 10.1002/1097-0258(20000915/30)19:17/18<2555::aidsim587>3.0.co;2-# [Crossref] [ Google Scholar]
- Schmid V, Held L. Bayesian extrapolation of space-time trends in cancer registry data. Biometrics 2004; 60(4):1034-42. doi: 10.1111/j.0006-341X.2004.00259.x [Crossref] [ Google Scholar]
- Blangiardo M, Cameletti M, Baio G, Rue H. Spatial and spatio-temporal models with R-INLA. Spat Spatiotemporal Epidemiol 2013; 4:33-49. doi: 10.1016/j.sste.2012.12.001 [Crossref] [ Google Scholar]
- Rue H, Martino S, Chopin N. Approximate Bayesian inference for latent Gaussian models by using integrated nested Laplace approximations. J R Stat Soc Series B Stat Methodol 2009; 71(2):319-92. doi: 10.1111/j.1467-9868.2008.00700.x [Crossref] [ Google Scholar]
- Besag J, York J, Mollié A. Bayesian image restoration, with two applications in spatial statistics. Ann Inst Stat Math 1991; 43(1):1-20. doi: 10.1007/bf00116466 [Crossref] [ Google Scholar]
- Spiegelhalter DJ, Best NG, Carlin BP, Van Der Linde A. Bayesian measures of model complexity and fit. J R Stat Soc Series B Stat Methodol 2002; 64(4):583-639. doi: 10.1111/1467-9868.00353 [Crossref] [ Google Scholar]
- Watanabe S. Asymptotic equivalence of Bayes cross validation and widely applicable information criterion in singular learning theory. J Mach Learn Res 2010; 11(12):3571-94. [ Google Scholar]
- Simkin J, Dummer TJB, Erickson AC, Otterstatter MC, Woods RR, Ogilvie G. Small area disease mapping of cancer incidence in British Columbia using Bayesian spatial models and the smallareamapp R package. Front Oncol 2022; 12:833265. doi: 10.3389/fonc.2022.833265 [Crossref] [ Google Scholar]
- Asmarian N, Ayatollahi SM, Sharafi Z, Zare N. Bayesian spatial joint model for disease mapping of zero-inflated data with R-INLA: a simulation study and an application to male breast cancer in Iran. Int J Environ Res Public Health 2019; 16(22):4460. doi: 10.3390/ijerph16224460 [Crossref] [ Google Scholar]
- Fekri N, Parsaeian M, Pourreza A, Swallow B, Amini A, Rahimi Foroushani A. The impact of cancer incidence on catastrophic health expenditure in Iran with a Bayesian spatio-temporal analysis. Iran J Public Health 2022; 51(2):438-49. doi: 10.18502/ijph.v51i2.8697 [Crossref] [ Google Scholar]
- Rastaghi S, Jafari-Koshki T, Mahaki B. Application of Bayesian multilevel space-time models to study relative risk of esophageal cancer in Iran 2005-2007 at a county level. Asian Pac J Cancer Prev 2015; 16(14):5787-92. doi: 10.7314/apjcp.2015.16.14.5787 [Crossref] [ Google Scholar]
- Halimi L, Bagheri N, Hoseini B, Hashtarkhani S, Goshayeshi L, Kiani B. Spatial analysis of colorectal cancer incidence in Hamadan province, Iran: a retrospective cross-sectional study. Appl Spat Anal Policy 2020; 13(2):293-303. doi: 10.1007/s12061-019-09303-9 [Crossref] [ Google Scholar]
- Carethers JM, Doubeni CA. Causes of socioeconomic disparities in colorectal cancer and intervention framework and strategies. Gastroenterology 2020; 158(2):354-67. doi: 10.1053/j.gastro.2019.10.029 [Crossref] [ Google Scholar]
- Luo Z, Dong X, Wang C, Cao W, Zheng Y, Wu Z. Association between socioeconomic status and adherence to fecal occult blood tests in colorectal cancer screening programs: systematic review and meta-analysis of observational studies. JMIR Public Health Surveill 2023; 9:e48150. doi: 10.2196/48150 [Crossref] [ Google Scholar]
- Elshair M, Ugai T, Oze I, Kasugai Y, Koyanagi YN, Hara K. Impact of socioeconomic status and sibling number on the prevalence of Helicobacter pylori infection: a cross-sectional study in a Japanese population. Nagoya J Med Sci 2022; 84(2):374-87. doi: 10.18999/nagjms.84.2.374 [Crossref] [ Google Scholar]
- Ford AC, Axon AT. Epidemiology of Helicobacter pylori infection and public health implications. Helicobacter 2010; 15 Suppl 1:1-6. doi: 10.1111/j.1523-5378.2010.00779.x [Crossref] [ Google Scholar]
- Jalali M. Nitrates leaching from agricultural land in Hamadan, western Iran. Agric Ecosyst Environ 2005; 110(3-4):210-8. doi: 10.1016/j.agee.2005.04.011 [Crossref] [ Google Scholar]
- Jahed-Khaniki G, Dehghani MH, Mahvi A, Rafati L, Tavanafar F. Concentrations of nitrate and nitrite in groundwater resources of Hamadan province, Iran. Res J Chem Environ 2008; 12(4):56-8. [ Google Scholar]
- Ebrahimi A, Vahidnia MH. Preparing demographic maps and spatial-statistical analysis of gastric cancer patients in Hamedan province. Scientific-Research Quarterly of Geographical Data (SEPEHR) 2021; 30(117):181-202. doi: 10.22131/sepehr.2021.244459 [Crossref] [ Google Scholar]