J Res Health Sci.23(2) :e00581.
doi: 10.34172/jrhs.2023.116
Original Article
A Hybrid of Random Forests and Generalized Path Analysis: A Causal Modeling of Crashes in 52,524 Suburban Areas
Fatemeh Jahanjoo 1  , Homayoun Sadeghi-Bazargani 1, Mohammad Ali Mansournia 2, Seyyed Teymoor Hosseini 3, Mohammad Asghari-Jafarabadi 1, 4, 5, 6, *
Author information:
1Road Traffic Injury Research Center, Tabriz University of Medical Sciences, Tabriz, Iran
2Department of Epidemiology and Biostatistics, School of Public Health, Tehran University of Medical Sciences, Tehran, Iran
3Department of Engineering Traffic and Transportation, Faculty of the Traffic, Tehran University, Tehran, Iran
4Cabrini Research, Cabrini Health, Malvern, VIC 3144, Australia
5Biostatistics Unit, School of Public Health and Preventative Medicine, Faculty of Medicine, Nursing and Health Sciences, Monash University, Melbourne, VIC 3004, Australia
6Department of Psychiatry, School of Clinical Sciences, Faculty of Medicine, Nursing and Health Sciences, Monash University, Clayton, VIC 3168, Australia
Abstract
Background: Determining suburban area crashes’ risk factors may allow for early and operative safety measures to find the main risk factors and moderating effects of crashes. Therefore, this paper has focused on a causal modeling framework.
Study Design: A cross-sectional study.
Methods: In this study, 52524 suburban crashes were investigated from 2015 to 2016. The hybrid-random-forest-generalized-path-analysis technique (HRF-gPath) was used to extract the main variables and identify mediators and moderators.
Results: This study analyzed 42 explanatory variables using a RF model, and it was found that collision type, distinct, driver misconduct, speed, license, prior cause, plaque description, vehicle maneuver, vehicle type, lighting, passenger presence, seatbelt use, and land use were significant factors. Further analysis using g-Path demonstrated the mediating and predicting roles of collision type, vehicle type, seatbelt use, and driver misconduct. The modified model fitted the data well, with statistical significance (
= 81.29,
P<0.001) and high values for comparative-fit-index and Tucker-Lewis-index exceeding 0.9, as well as a low root-mean-square-error-of-approximation of 0.031 (90% confidence interval: 0.030-0.032).
Conclusion: The results of our study identified several significant variables, including collision type, vehicle type, seatbelt use, and driver misconduct, which played mediating and predicting roles. These findings provide valuable insights into the complex factors that contribute to collisions via a theoretical framework and can inform efforts to reduce their occurrence in the future.
Keywords: Accident, Traffic accidents, Causal effect, Regularization algorithm, Generalized path analysis
Copyright and License Information
© 2023 The Author(s); Published by Hamadan University of Medical Sciences.
This is an open-access article distributed under the terms of the Creative Commons Attribution License (
https://creativecommons.org/licenses/by/4.0/), which permits unrestricted use, distribution, and reproduction in any medium, provided the original work is properly cited.
Please cite this article as follows: Jahanjoo F, Sadeghi-Bazargani H, Mansournia MA, Hosseini ST, Asghari-Jafarabadi M. A hybrid of random forests and generalized path analysis: a causal modeling of crashes in 52,524 suburban areas. J Res Health Sci. 2023; 23(2):e00581. doi:10.34172/jrhs.2023.116
Background
Road traffic accidents (RTCs), as the cause of about 1.35 million deaths and 50 million serious injuries worldwide, represent a severe social and economic problem. In addition, it considers approximately 3% of the gross domestic product in 2018.1,2 Although all RTCs are problematic, research shows that fatality rates in suburban regions are greater.3,4 Suburban roadways play a transitional high-speed roadway role in connecting low-speed urban roads with high-speed rural highways. Notably, suburban areas have the properties of both urban (i.e., use of gutter and curb for drainage) and rural (i.e., high-pace) roadways. Consequently, enhancement in road safety seems to be refuted if these commutating areas are not taken into consideration. Therefore, to reduce road accidents and its consequence on road traffic, analyzing the characteristics of suburban crashes separately and providing the corresponding statistical model in full detail are of utmost importance.5
Traditional statistical modeling, including regression models and linear approaches, has consistently been implemented in crash severity analysis.6,7 However, these models have to fulfill several assumptions about the fundamental structure of data and the structure of the relationships between independent and dependent variables. If the assumptions are violated, biased estimations and improper inferences can be obtained.8 Machine learning techniques as applied statistical methods have been considerably utilized in data analysis. These techniques do not contain pre-defined relationships between study variables, and the prediction is available without needing to understand essential mechanisms. These methods are currently successful due to the development of computational power.6,9
Additionally, even though large population studies are routinely used to estimate the effect of predictors in actual situations, they are subject to confounding bias due to the lack of randomization. Hence, methods from the causal inference framework could be investigated as a strategy for developing sound and relevant science. Moreover, there is always difficulty with the number of variables that must be entered into the conceptual diagram of causal modeling, particularly in traffic studies with many risk factors. First, relying solely on substantive knowledge makes it challenging to detect true confounders. Second, neglecting a true confounder could result in biased conclusions, while accounting for non-confounders could raise variance.10,11
Based on the literature in various disciplines, random forests (RF) as machine learning techniques and path analysis as a causal approach were revealed to be a good approach for road traffic crash injury severity prediction.12,13 The RF proves to be a reliable algorithm for feature selection, even if the number of features is high. It has proven itself to be reliable, robust, and efficient. Furthermore, it outperforms other black-box algorithms as it is trained by a bootstrap aggregating (bagging) algorithm. This not only enhances the stability and accuracy of individual trees but also reduces variance and prevents over-fitting. The RF is also known for its interpretable model by producing a set of boosted if-then rules.14,15 Path analysis is a useful statistical tool for investigating the causal relationships between variables. It combines bivariate and multi-variable linear regression to examine the causal relations among the variables in model.16 This method can accurately determine the influence and significance of the relationship between various variables.17 In this paper, a hybrid random forest generalized path analysis (HRF-gPath) method was proposed to maintain sufficient number and efficient variables in the causal model of suburban area crashes. Beyond the methodological novelty proposed in this paper, combining these methods would lead to optimal feature selection and provide a powerful causal approach for a better conclusion. The results of this study can prepare guidelines and provide information for specialists to decide on the crucial risk factors of traffic crashes in suburban areas based on scientific evidence.
Methods
Study design
This cross-sectional study analyzed the information on suburban crashes recorded in Integrated Road Traffic Injury Registry System (IRTIRS)18 from March 2015 to March 2016. The IRTIRS development as a national research study was started in 2017. The World Health Organization, the Iranian Ministry of Health, the Iranian Traffic Police, and the Iranian Forensic Medicine Organization are in charge of this multi-method study. In collaboration with other interested organizations, the Ministry of Health and Medical Education and the Road Traffic Injury Research Center affiliated with Tabriz University of Medical Sciences have taken steps to develop the information registration system to create an integrated system for data collection.
Ethics approval and consent to participate
The study was conducted following the Declaration of Helsinki and approved by the Institutional Review Board (#1396.465) and the Ethics Committee (#IR.TBZMED.REC.1398.1244) of Tabriz University of Medical Sciences, Iran. Participation in the study was voluntary for everyone, and participants’ privacy was respected. The participants were assured that their personal information would remain confidential and not be disclosed. Informed consent was obtained from both the adult participants and the parent(s)/guardian(s) of all under-16s; furthermore, informed consent was obtained from legal guardians or next of kin for illiterate participants. All methods were performed following the relevant guidelines and regulations. Finally, informed consent was obtained from all individual participants included in the study.
Data collection and study variables
The scene of the crash-, vehicle-, and driver-based information was collected in the most critical provinces in Iran, which are either capital city destinations, tourism destinations, or free zone areas. Crash-based information included passenger presence, pedestrian presence, crash day, crash type, time, lighting status, weather, zone type, intersection control, line making, road material, land use, crash mechanism, view obstacle, and crash position. Other crash-related information were road surface, geometric design, vehicle factor, human factor, cause of the accident, collision type, distinct, road shoulder, road defect, permitted speed, and road repairing status. Moreover, vehicle-based information contained vehicle safety equipment, type, color, life, maneuver, plaque description, moving direction, and maneuver. Eventually, driver-based information included age, gender, education, job, driving license, seat belt usage, judiciary cause, and misconduct. This study divided the district into three categories, including tourist destinations, capital destinations, and free zones. As the final issue, the crash severity has three categories: property damage, injury, and fatality. Based on the study purpose, severity data were categorized into two distinct categories, including (1) damage or injury as a non-fatal crash (Y = 0) and (2) fatality as a fatal crash (Y = 1). There were 2,399 (4.57%) fatal crashes out of 52,524 suburban crashes. Overall, the information related to 42 explanatory variables was recorded, the details of which are presented in Table 1.
Table 1.
Explanatory variables description in suburban area crashes based on the Iranian Integrated Road Traffic Injury Registry System (2015-2016)
|
Variable
|
Total crashes
|
Fatal crashes
|
|
Number
|
Percent
|
Number
|
Percent
|
| Passenger presence |
7643 |
14.55 |
1077 |
14.09 |
| Pedestrian presence |
1612 |
3.07 |
172 |
10.67 |
| Crash day (Weekend) |
16 002 |
30.47 |
802 |
5.01 |
| Lightning |
|
|
|
|
| Day |
35 790 |
68.14 |
1350 |
3.77 |
| Night |
14 482 |
27.57 |
900 |
6.21 |
| Twilight/dawn |
2252 |
4.29 |
149 |
6.62 |
| Weather |
|
|
|
|
| Clear/cloudy |
50 601 |
96.34 |
2327 |
4.60 |
| Foggy/stormy/dusty |
211 |
0.40 |
4 |
1.90 |
| Rainy |
1400 |
2.67 |
65 |
4.64 |
| Snowy |
312 |
0.59 |
3 |
0.96 |
| Zone type |
|
|
|
|
| Smooth |
49 690 |
94.60 |
2219 |
4.47 |
| Rough |
778 |
1.48 |
58 |
7.46 |
| Mountainous |
2056 |
3.91 |
122 |
5.93 |
| Existing intersection control |
43 147 |
82.15 |
1905 |
4.42 |
| Road lane line marking |
|
|
|
|
| Broken line |
3831 |
7.29 |
331 |
8.64 |
| No line |
124 |
0.24 |
5 |
4.03 |
| Solid line |
13 840 |
26.35 |
841 |
6.08 |
| Double solid line |
38 684 |
73.65 |
1558 |
4.03 |
| Road material (Asphalt) |
315 |
0.60 |
29 |
9.21 |
| Land use |
|
|
|
|
| Residential |
9696 |
18.46 |
268 |
2.76 |
| Nonresidential |
34 195 |
65.10 |
1755 |
5.13 |
| Other uni-purpose areas |
7386 |
14.06 |
318 |
4.31 |
| Multipurpose area |
1247 |
2.37 |
58 |
4.65 |
| Crash mechanism |
|
|
|
|
| Single-vehicle crashes |
13 425 |
25.56 |
691 |
5.15 |
| Multiple-vehicle crashes |
29 587 |
56.33 |
1087 |
3.67 |
| Involving vulnerable road user crashes |
9512 |
18.11 |
621 |
6.53 |
| Existing view obstacle |
1291 |
2.46 |
72 |
5.58 |
| Crash position in riding lane |
46 823 |
89.15 |
1959 |
4.18 |
| Dry road surface |
50 302 |
95.77 |
2303 |
4.58 |
| Curved geometric design |
6236 |
11.87 |
469 |
7.52 |
| Existing vehicle factor |
480 |
0.91 |
29 |
6.04 |
| Existing human factor |
31 166 |
59.34 |
1639 |
5.26 |
| First cause |
|
|
|
|
| More training |
36 496 |
69.48 |
1664 |
4.56 |
| Irresponsibility |
10 327 |
19.66 |
237 |
2.29 |
| More training and irresponsibility |
5430 |
10.34 |
445 |
8.20 |
| Failure of state organs |
61 |
0.12 |
7 |
11.48 |
| Multiple factors |
210 |
0.40 |
46 |
21.90 |
| Prior cause |
|
|
|
|
| Hasty driving |
20 478 |
38.99 |
863 |
4.21 |
| Lack of attention to driving |
24 238 |
46.15 |
904 |
3.73 |
| Hasty driving and lack of attention to driving |
3109 |
5.92 |
183 |
5.89 |
| Lacked skill |
2155 |
4.10 |
163 |
7.56 |
| Other |
2544 |
4.84 |
286 |
11.24 |
| Direct cause |
|
|
|
|
| Regulation |
44 070 |
83.90 |
1876 |
4.26 |
| Delay in sighting |
4426 |
8.43 |
299 |
6.76 |
| Overspending |
3631 |
6.91 |
209 |
5.76 |
| Escaping crash in a wrong way or multiple factors |
397 |
0.76 |
15 |
3.78 |
| Collision type |
|
|
|
|
| Rear-end collisions |
7958 |
15.15 |
912 |
11.46 |
| T-bone collision |
22 694 |
43.21 |
732 |
3.23 |
| Head-on collision |
15 624 |
29.75 |
584 |
3.74 |
| Side-swipe collision |
4333 |
8.25 |
93 |
2.15 |
| Fixed-object collision |
1915 |
3.65 |
78 |
4.07 |
| Distinct |
|
|
|
|
| Tourism destination |
37 116 |
70.66 |
2065 |
22.55 |
| Capital city destination |
12 661 |
24.11 |
238 |
61.88 |
| Free zone |
2747 |
5.23 |
96 |
3.49 |
| Road shoulder |
|
|
|
|
| Unpaved |
20 181 |
38.42 |
643 |
3.19 |
| Soil |
19 158 |
36.47 |
1007 |
5.26 |
| Asphalt |
13 185 |
25.10 |
749 |
5.68 |
| Road defect |
|
|
|
|
| No |
47 458 |
90.35 |
1988 |
4.19 |
| Pavement/lightning defects |
1643 |
3.13 |
106 |
6.45 |
| Signs defects |
1360 |
2.59 |
119 |
8.75 |
| Geometric defects |
593 |
1.13 |
40 |
6.75 |
| Multiple defects |
1470 |
2.80 |
146 |
9.93 |
| Permitted speed (km/h) |
|
|
|
|
| ≤ 30 |
3133 |
5.96 |
95 |
3.03 |
| 30-50 |
14 043 |
26.74 |
267 |
1.90 |
| 50-60 |
11 070 |
21.08 |
258 |
2.33 |
| 60-80 |
7754 |
14.76 |
303 |
3.91 |
| 80-95 |
6883 |
13.10 |
702 |
10.20 |
| 95-110 |
7442 |
14.17 |
609 |
8.18 |
| 110-120 |
2199 |
4.19 |
165 |
7.50 |
| Road repairing |
1050 |
2.00 |
53 |
5.05 |
| Having vehicle safety equipment |
6175 |
11.76 |
318 |
5.15 |
| Vehicle color (High risk) |
19 846 |
37.78 |
954 |
4.81 |
| Vehicle life (Year) |
|
|
|
|
| < 5 years |
11 585 |
22.06 |
609 |
5.26 |
| 5-9 |
26 362 |
50.19 |
972 |
3.69 |
| 10-14 |
11 516 |
21.93 |
534 |
4.64 |
| ≥ 15 |
3061 |
5.83 |
284 |
9.28 |
| State vehicle plaque description |
15 217 |
28.97 |
861 |
5.66 |
| Vehicle moving direction (Cardinal) |
331 |
0.63 |
14 |
4.23 |
| Vehicle maneuver |
|
|
|
|
| Moving forward |
49 989 |
95.17 |
2251 |
4.50 |
| Turning |
1806 |
3.44 |
58 |
3.21 |
| Overtaking |
111 |
0.21 |
20 |
18.02 |
| Moving backward |
209 |
0.40 |
7 |
3.35 |
| Stopping on the road |
127 |
0.24 |
12 |
9.45 |
| Other |
282 |
0.54 |
51 |
18.09 |
| Driver being at fault |
34 032 |
64.79 |
1660 |
4.88 |
| Driver gender (Male) |
50 188 |
95.55 |
2331 |
4.64 |
| Driver education |
|
|
|
|
| Illiterate |
1418 |
2.70 |
69 |
4.87 |
| Primary |
3996 |
7.61 |
148 |
3.70 |
| Nonacademic |
43 115 |
82.09 |
2062 |
4.78 |
| Academic |
3995 |
7.61 |
120 |
3.00 |
| Driver job |
|
|
|
|
| Jobs with high economic status |
46 689 |
88.89 |
2142 |
4.59 |
| Jobs with middle economic status |
3454 |
6.58 |
176 |
5.10 |
| Jobs with low economic status |
2381 |
4.53 |
81 |
3.40 |
| Driver age |
|
|
|
|
| Child |
477 |
0.91 |
24 |
5.03 |
| Adult |
49 497 |
94.24 |
2246 |
4.54 |
| Elderly |
2550 |
4.85 |
129 |
5.06 |
| Type of driving license |
|
|
|
|
| Class A |
8434 |
16.06 |
336 |
3.98 |
| Class B |
16 015 |
30.49 |
408 |
2.55 |
| Class C |
26 422 |
50.30 |
1580 |
5.98 |
| Motorcycle |
458 |
0.87 |
3 |
0.66 |
| No license |
1195 |
2.28 |
72 |
6.03 |
| Driver does not wear a seatbelt |
20 463 |
38.96 |
1150 |
5.62 |
| Driving carelessly |
1415 |
2.69 |
181 |
12.79 |
| Driver misconduct |
|
|
|
|
| Spiral movement |
27 169 |
51.73 |
139 |
0.51 |
| Over speeding |
21 313 |
40.58 |
1630 |
7.65 |
| Other |
4042 |
7.70 |
630 |
15.59 |
Statistical analysis
Statistical data were analyzed using STATA (Release 17: 2021, StataCorp LCC, College Station, Texas 77845-4512 USA), TIBCO STATISTICA (Release 13.5.0.17: 2018, Statsoft, inc. USA), and MPlus (Release 7.4: 2015, Los Angeles, CA: Muthén & Muthén). The proposed hybrid model initiates with the RF classifier for variable selection, followed by generalized path analysis to conduct causal modeling. In the first step of the proposed HRF-gPath model, the RF classifier efficiently reduces less important variables and enhances the proposed model’s generalization capabilities. The RF is a supervised machine learning technique introduced by Breiman’s19 and focuses on the “decision tree” approach implemented in the classification and regression tree methodology. The decision tree is considered a technique for classifying data that are divided into groups based on the value of a particular variable. Then, it repeats this division such that each data group comprises objective variables in the same category. In this method, the basis of most decisions is classification. In addition, the importance of each variable and the contribution of each variable in data classification can be determined by the created decision trees. This study used classification algorithms to predict a categorical dependent variable. The risk was calculated as the proportion of cases incorrectly classified by the trees. The Gini index (GI) was employed to reduce the node impurity. Our optimal model was trained to have a GI around 0.1. To control all key aspects of the estimation procedure and model parameters, including the complexity of the trees fitted to the data, the maximum number of trees in the forest was set to 100. Additionally, to control how to stop the algorithm when achieving satisfactory results, the maximum number of leaves was set to 10.19 The data were randomly split into training and test sets so that the training set consisted of 80% of the full data set, while the test set comprised the remaining 20%. The training set was utilized to fit (train) the model. The test set was used to evaluate the fitted RF performance and determine whether it is overfitting. The research team took the mid-point of 0.5 as the cutoff point for deciding on the feature selection criterion and introducing it to gPath analysis.
To maximize the advantages of the algorithm in this hybrid approach and to bring it into the causal framework, the output data from the RF classifier with the selected variables were then presented to the gPath to fit a causal model to the data. There were six steps in each path modeling, including model specification, model identification, model estimation, model testing, model modification, and model validation. Model specification involves detecting relationships among a set of study variables. In this step, a graphical presentation of the model is applied to create a conceptual model. Model identification includes formulating the relationships presented in the model specification phase and guaranteeing that the model is fitted properly. In the model estimation step, the set of equations is solved simultaneously to estimate the model fitting parameters.20 In this study, the weighted least square mean and variance-adjusted estimator was employed, which is a robust one and does not assume a normal distribution for variables. In addition, it provides the best option for modeling categorical or ordered data. The indices, including chi-square test/degree of freedom values (
) below five, Tucker-Lewis index (TLI), and comparative fit index (CFI) values over 0.90 were used for model goodness of fit.21,22 The root means square error of approximation (RMSEA) was the next measure of goodness-of-fit, with values below 0.05 being considered a good fit and values up to.08 representing acceptable errors in the population.20 For an inadequate model, the model modification includes adjusting an identified and estimated model through modification indices provided by the model. In this study, the bootstrap method was utilized for model validation.
Results
From March 2015 to March 2016, IRTIRS registered 384 614 traffic crashes. The suburban area crashes comprised 52 524 (13.66%) of the causalities. The fatality rate among these crashes was 4.6% (2399 cases). Table 1 provides details about the frequency distribution of crash scenes, vehicles, and driver-related variables describing the crashes.
Results of the random forests model
The results of RF feature selection demonstrated that 12 variables, namely, collision type, distinct, driver misconduct, permitted speed, driver’s license, plaque description, vehicle maneuver, vehicle type, lighting status, passenger presence, driver seat belt, and land use, were derived as significant variables. Risk estimates and corresponding standard errors were 0.046 and 0.001 for the training and test sets. Figure 1 recapitulates the results of the RF model in more detail.
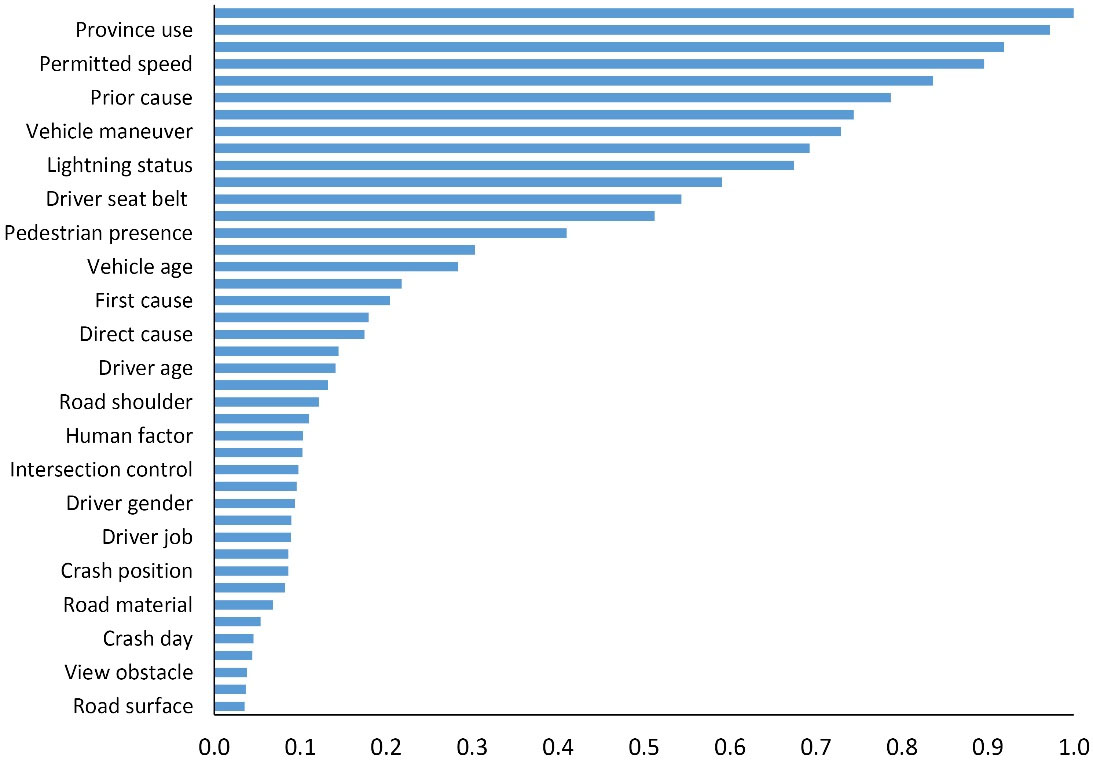
Figure 1.
Variables’ importance based on the random forest model
.
Variables’ importance based on the random forest model
Results of the hybrid RF- gPath model
Although the RF method was used to select variables, understanding the potential for multicollinearity between the inventory variables, we checked the correlation between independent variables to ensure they were not highly correlated. Figure 2 shows a correlation matrix for all the variables introduced to the causality model. The color coding represents how correlated two variables are, with dark blue and dark red squares representing a strong positive correlation ( + 0.7 to + 1) and a strong negative correlation (-1 to -0.7), respectively.23 According to the figure, the correlations between variables are not strong enough for any substantial collinearity or multicollinearity.24
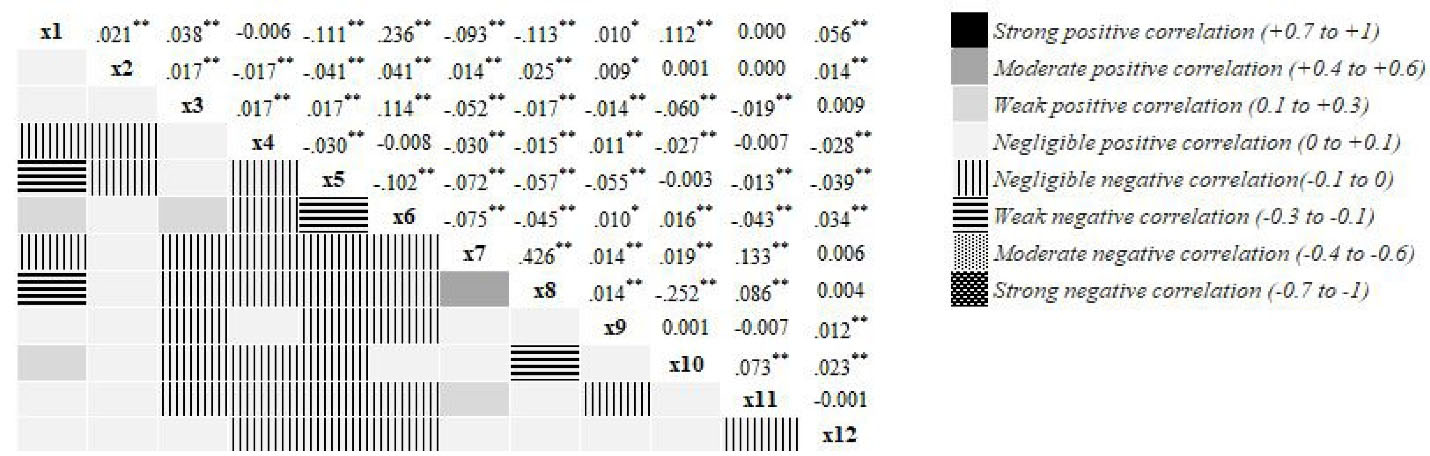
Figure 2.
Correlation matrix for variables within the hybrid RF-gPath model. Note. RF: Random forests. **Correlation is significant at the 0.01 level (2-tailed). * Correlation is significant at the 0.05 level (2-tailed). x1: Passenger presence, x2: Lighting status, x3: Land use, x4: Collision type, x5: Distinct; x6: Permitted speed; x7: Vehicle type, x8: Plaque description, x9: Vehicle maneuver, x10: Driver license, x11: Driver seat belt, and x12: Driver misconduct
.
Correlation matrix for variables within the hybrid RF-gPath model. Note. RF: Random forests. **Correlation is significant at the 0.01 level (2-tailed). * Correlation is significant at the 0.05 level (2-tailed). x1: Passenger presence, x2: Lighting status, x3: Land use, x4: Collision type, x5: Distinct; x6: Permitted speed; x7: Vehicle type, x8: Plaque description, x9: Vehicle maneuver, x10: Driver license, x11: Driver seat belt, and x12: Driver misconduct
A conceptual model of variables extracted from the RF model (Figure 3a) was constructed to answer the research question. Figure 3b illustrates the modified model, where the values on the arrows represent standardized regression coefficients from one variable to another, which are the direct effects. The modified model fitted the data reasonably enough with
= 81.29, P < 0.001,
= 2.71 < 5, CFI = 0.97 > .9, TLI = 0.95 > 0.9, and RMSEA = 0.031 < 0.08 (90% confidence interval [CI]: 0.030 to 0.032). Table 2 provides direct, indirect, and total effects ending in the outcome. Bootstrap confirmed the model validation as having an acceptable overlap of method confidence intervals with model-derived confidence intervals and negligible biases.
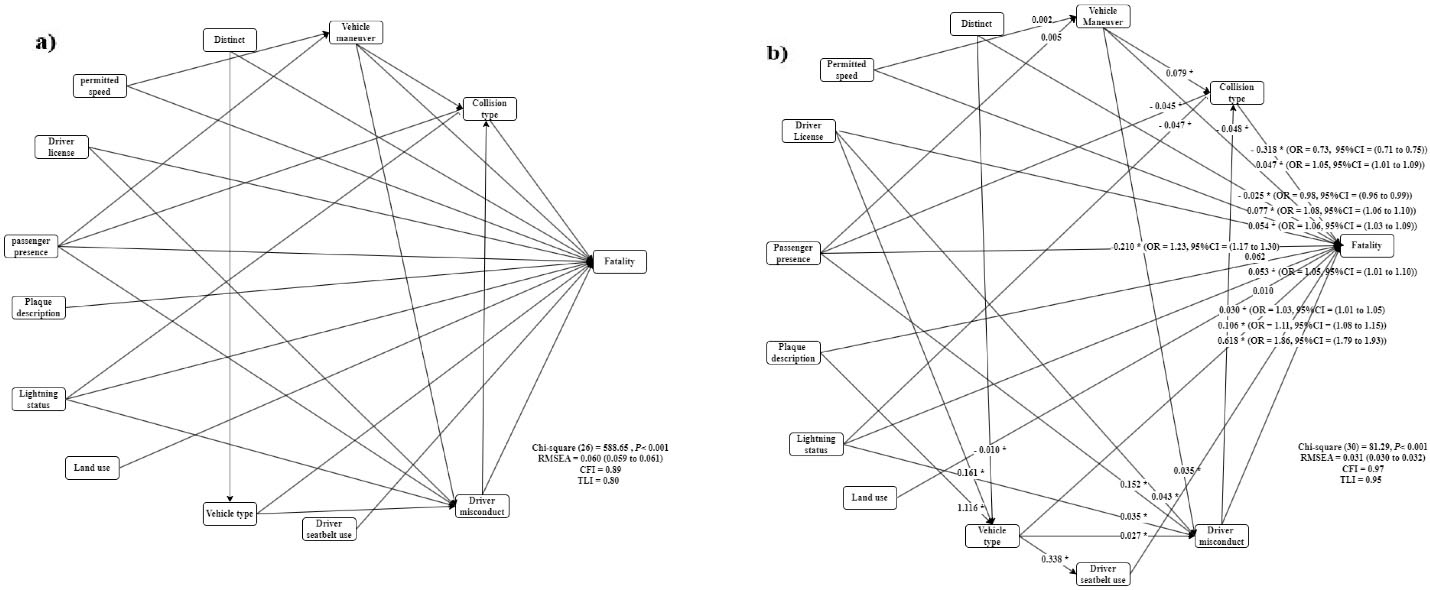
Figure 3.
(a) Hypothesized conceptual model and (b) perfect fitted model with standardized path coefficients in assessing the effects of risk factors on fatality in suburban area crashes (*P < 0.05)
.
(a) Hypothesized conceptual model and (b) perfect fitted model with standardized path coefficients in assessing the effects of risk factors on fatality in suburban area crashes (*P < 0.05)
Table 2.
Standardized direct, indirect, and total effects ending in the outcome (fatality)
|
Variables/Effect
|
Estimate
|
SE
|
P
value
|
| Collision type |
|
|
|
| Direct |
-0.318 |
0.012 |
0.001 |
| Indirect |
-0.108 |
0.041 |
0.001 |
| Total |
-0.426 |
0.016 |
0.001 |
| Maneuver |
|
|
|
| Direct |
0.047 |
0.022 |
0.029 |
| Indirect |
0.000 |
0.000 |
0.001 |
| Total |
0.047 |
0.022 |
0.029 |
| Distinct |
|
|
|
| Direct |
-0.025 |
0.008 |
0.002 |
| Indirect |
0.000 |
0.000 |
0.001 |
| Total |
-0.025 |
0.008 |
0.002 |
| Permitted speed |
|
|
|
| Direct |
0.077 |
0.008 |
0.001 |
| Indirect |
0.000 |
0.000 |
0.001 |
| Total |
0.077 |
0.008 |
0.001 |
| Driver license |
|
|
|
| Direct |
0.054 |
0.015 |
0.001 |
| Indirect |
0.023 |
0.005 |
0.001 |
| Total |
0.077 |
0.015 |
0.001 |
| Passenger presence |
|
|
|
| Direct |
0.210 |
0.026 |
0.001 |
| Indirect |
0.104 |
0.010 |
0.001 |
| Total |
0.314 |
0.027 |
0.001 |
| Plaque description |
|
|
|
| Direct |
0.062 |
0.041 |
0.105 |
| Indirect |
0.084 |
0.030 |
0.005 |
| Total |
0.146 |
0.027 |
0.001 |
| Lightning status |
|
|
|
| Direct |
0.053 |
0.020 |
0.008 |
| Indirect |
0.000 |
0.000 |
0.001 |
| Total |
0.053 |
0.020 |
0.008 |
| Land use |
|
|
|
| Direct |
0.010 |
0.021 |
0.621 |
| Indirect |
0.000 |
0.000 |
0.001 |
| Total |
0.010 |
0.021 |
0.621 |
| Vehicle type |
|
|
|
| Direct |
0.030 |
0.010 |
0.027 |
| Indirect |
0.049 |
0.005 |
0.005 |
| Total |
0.079 |
0.027 |
0.005 |
| Driver seatbelt usage status |
|
|
|
| Direct |
0.106 |
0.016 |
0.001 |
| Indirect |
0.000 |
0.000 |
0.001 |
| Total |
0.106 |
0.016 |
0.001 |
| Driver misconduct |
|
|
|
| Direct |
0.618 |
0.019 |
0.001 |
| Indirect |
0.000 |
0.000 |
0.001 |
| Total |
0.618 |
0.019 |
0.001 |
Note. SE: Standard error.
Indirect effects
All coefficients on the perfect fitted model were statistically significant at the 0.05 level of significance, except for the path from the vehicle plaque description and land use toward fatality, as well as the path from permitted speed and the presence of passenger toward vehicle maneuver. The results revealed that the presence of a passenger increased the odds of fatal crashes by 1.23 times (1.23, 1.17 to 1.30). Drivers not wearing a seatbelt had 11% higher odds of dying in a suburban area crash (1.11, 1.08 to 1.15). The odds of fatality increased by 1.86 for drivers engaging in misconduct (1.86, 1.79 to 1.93).
Furthermore, the findings demonstrated a significant direct relationship between fatality vehicle maneuver (odds ratio [OR] = 1.05, 95% CI: 1.01 to 1.09), permitted speed (OR = 1.08, 95% CI: 1.06 to 1.10), driver license (OR = 1.06, 95% CI: 1.03 to 1.09), lightning status (1.05, 1.01 to 1.10), and vehicle type (1.03, 1.01 to 1.05). Further, a significant converse relationship was found between fatality and collision type (0.73, 0.71 to 0.75), as well as fatality and distinct (0.98, 0.96 to 0.99).
Mediation effects of risk factors on fatality outcome
The mediated path model indicated that collision type mediated the effect of vehicle maneuver (β = 0.079,95% CI = 0.059 to 0.099), presence of passenger (β = -0.045,95% CI = -0.070 to -0.020), lightening status (β = -0.047,95% CI = -0.063 to -0.031), and driver misconduct (β = -0.045,95% CI = -0.058 to -0.038) on fatality. The strongest association was observed between fatality and vehicle maneuver. Although the paths from permitted speed and the presence of passengers with fatality were mediated by vehicle maneuvers, they were insignificant. Vehicle type mediated the effect of distinct (β = -0.010,95% CI = -0.012 to - 0.008), driver license (β = 0.161,95% CI = 0.155 to 0.167), and plaque description (β = 1.116,95% CI = 1.106 to 1.126) on fatality.
There was a positive indirect effect for vehicle type on fatality through the driver seat belt (β = 0.338,95% CI = 0.320 to 0.356). Furthermore, vehicle maneuver (β = 0.035,95% CI = 0.015 to 0.055), driver license (β = 0.043,95% CI = 0.031 to 0.055), presence of a passenger (β = 0.152,95% CI = 0.123 to 0.181), lightning status (β = 0.035,95% CI = 0.017 to 0.053), and vehicle type (β = 0.027,95% CI = 0.011 to 0.043) were significantly and indirectly related to fatality through driver misconduct (Figure 3b).
Discussion
This is the first study that discovered the applicability of the innovative HRF-gPath model for detecting causal relationships and predicting fatality in suburban crashes. The proposed novel HRF-gPath chose a reasonable number of features and showed their direct and indirect relationships.
Interestingly, the association between vehicle maneuver, presence of passenger, lightning status, and driver misconduct paths with fatality were mediated by collision type. Moreover, distinct, driver’s license and plaque descriptions affected the vehicle type and, consequently, fatality, which is consistent with the findings of a previous study.25 The relationship between vehicle types by fatality was mediated by seat belt use. Furthermore, driver misconduct played a mediator role in assessing the relationship between fatality and variables such as vehicle maneuver, driver license, presence of a passenger, lightning status, and vehicle type. Collision type, vehicle type, seat belt use, and driver misconduct demonstrated a significant relationship with fatality. Therefore, this explored model could be considered a typical practical, theoretical framework to explain how the collision type, vehicle type, seat belt use, and driver misconduct can predict and mediate fatality in suburban crashes. Further studies can modify and establish this model.
Based on the results of the present study, vehicle maneuver, presence of a passenger, lightning status, and driver misconduct could be considered significant predictors of collision type. The significant relation between vehicle maneuvers and collision type indicates that different vehicle maneuvers would lead to different collision types. Overtaking while driving, as the main cause of head-on collisions with serious consequences, can be a salient example of this relationship, as reported in other studies.26,27 Consistent with the results of international research, the presence of a passenger may reduce attention to the driving task and exert direct or indirect psychological pressure to drive less safely. In the same vein, it can be assumed that the presence of a passenger may lead to increased stress and thus reduced driving performance.28 However, we cannot make any assumptions about the risky role of passenger presence, which is similar to the finding of the study conducted by Orsi et al. They concluded that young drivers, carrying passengers, were particularly vulnerable in single-vehicle collisions; yet, for adult drivers, this collision was more harmful if the driver was alone in the vehicle,16 which is in line with the results regarding the relationship between lightning status and collision type. The studies assessing rear-end crash exposure methodology revealed that daytime was attributed to many rear-end collisions.29 Studies have reported driver misconduct as a predictor of collision type. Goel and Sachdeva had studied the reasons for the collisions, their kind when they occurred, and the kind of the involved vehicle. They found that head-on or rear-end collisions are mainly due to driver misconduct.30
Considering the division of distinct (tourism destination, capital city destination, and free zone), the relationship between the distinct and the vehicle type is quite clear. Based on the results of this study, the distribution of heavy vehicles in the capital destination has a different pattern than in a tourist destination and the free zone. Tehran, the capital of Iran, is the economic center of Iran, with more than 45% of large industrial factories.31 Therefore, these factories increase the use of heavy vehicles for road freight transport. Similar studies represented that freight vehicles are heavier and increase the kinetic energy in accidents compared to passenger vehicles. In addition, capital cities usually have limited infrastructure for freight infrastructure, including loading space, road space, and parking, to accommodate the increasing freight traffic. These limitations further challenge the safe and efficient operation of heavy vehicles.32
According to the results of similar studies in Iran, car by itself has effects whether or not drivers decide to use seat belts. For example, sport utility vehicles and van drivers are less likely to use seat belts.33,34
Among all variables, the presence of a passenger was a stronger predictor of diver misconduct. Talking to the passenger has been identified as a distractor and a predictor of driver misconduct.35 It has been concluded that professional drivers have a lower probability of risky driving behaviors. However, this is in contrast with the findings of a study by Mekonnen et al, indicating that diver misconduct is common among professional drivers.36
As a third significant predictor of driver misconduct, vehicle maneuver plays a crucial role. Based on the findings of similar studies, the likelihood of misconduct increases by 2.98 and 2.15 times for drivers who engage in overspeeding and those who frequently make dangerous overtakes, respectively.37 Lightning status is the other significant predictor of driver misconduct. There is solid evidence from some studies that driving in dim light makes it harder to prevent crashes. As the number of miles traveled at night is significantly lower than during the day, drivers are more likely to drive faster during the daytime than at night.37,38 In terms of the relationship between driver misconduct and vehicle type, it is believed that as the key participant in the goods industry, drivers of heavy vehicles are one of the main factors of traffic safety. In the study of traffic collisions involving heavy vehicles, it was declared that 90% were found to be the result of driver misconduct.39
As the first limitation, there is no precise and detailed registry system in the country to combine this information with hospital information. As a result, only information on death at the scene is available, and therefore the results cannot be generalized to cases of death in the hospital. Another problem of this study is that accidents are probably not reported fully to the authorities. Focusing on the data between 2015 and 2016 and a restriction to access data from 2016 to 2021, which would enlarge and improve this research, can be considered the main limitation of this study. Like most classification problems, this study is limited by its imbalanced data. Although balancing data before conducting a random forest model can improve model performance and accurate evaluation metrics, it may lead to information loss, time and computational resources increase, and real-world imbalance mismatch. Hence, experimenting with both balanced and imbalanced datasets to assess the impact on model performance and choose the approach that best aligns with the problem is recommended for further studies.
On the other hand, this study was based on information from six densely populated provinces of the country, thus this can be considered the study’s first strength, making the results generalizable. This study introduced a hybrid approach for analyzing traffic crash data to develop a parsimonious model for suburban area crashes, which can be another study strength.
Highlights
-
We proposed a hybrid random forest generalized path analysis (HRF-gPath) model.
-
Collision, vehicle type, seatbelt, and misconduct predict and mediate crash events.
-
The HRF-gPath model provides a good fit for identifying suburban crash risk factors.
Conclusion
The proposed novel HRF-gPath model helped us identify reasoned pathways of fatal crashes in suburban areas. When exogenous and mediator variables are modeled together, all may predict fatality. As mediator variables, collision type, vehicle type, seat belt use, and driver misconduct originate from risk factors underlying this predicament. It is suggested that further research explores the unseen biases of the issue. Healthcare providers, police, and psychologist should consider the dominance of mediators explored in this study while designing prevention programs for suburban area crashes.
Acknowledgments
We are thankful to all people who helped us to conduct this study. The authors would like to acknowledge the staff of the Road Traffic Injury Research Center of Tabriz University of Medical Sciences for supporting this study. This is a database report from a Ph.D. thesis registered in Tabriz University of Medical Sciences with No. 64041 by Fatemeh Jahanjoo.
Authors’ Contribution
Conceptualization: Mohammad Asghari-Jafarabadi, Homayoun Sadeghi-Bazargani, Fatemeh Jahanjoo, Seyyed Teymoor Hosseini.
Data curation: Mohammad Asghari-Jafarabadi, Homayoun Sadeghi-Bazargani, Fatemeh Jahanjoo.
Formal analysis: Mohammad Asghari-Jafarabadi, Fatemeh Jahanjoo
Funding acquisition: Mohammad Asghari-Jafarabadi, Homayoun Sadeghi-Bazargani.
Investigation: Homayoun Sadeghi-Bazargani, Mohammad Asghari-Jafarabadi.
Methodology: Mohammad Asghari-Jafarabadi, Homayoun Sadeghi-Bazargani, Fatemeh Jahanjoo.
Project administration: Mohammad Asghari-Jafarabadi.
Resources: Mohammad Asghari-Jafarabadi, Homayoun Sadeghi-Bazargani.
Software: Mohammad Asghari-Jafarabadi, Fatemeh Jahanjoo.
Supervision: Mohammad Asghari-Jafarabadi.
Validation: Mohammad Asghari-Jafarabadi, Homayoun Sadeghi-Bazargani, Mohammad Ali Mansournia.
Visualization: Mohammad Asghari-Jafarabadi, Fatemeh Jahanjoo.
Writing–original draft: Mohammad Asghari-Jafarabadi, Fatemeh Jahanjoo.
Writing–review & editing: Mohammad Asghari-Jafarabadi, Homayoun Sadeghi-Bazargani, Fatemeh Jahanjoo, Mohammad Ali Mansournia, Seyyed Teymoor Hosseini.
Competing Interests
The authors declare no conflict of interests associated with this manuscript.
Ethical Approval
This study was approved by Institutional Review Board of Tabriz University of Medical Sciences (TUOMS) with ethics code: IR.TBZMED.REC.1398.1244.
Funding
This study was based on data from Fatemeh Jahanjoo’s Ph.D. thesis, which was financially supported by the Research Deputy of the Tabriz University of Medical Sciences (TUOMS) under Grant No. 64041.
References
- World Health Organization (WHO). Global Status Report on Road Safety 2018. WHO; 2018.
- Rezapur-Shahkolai F, Vesali-Monfared E, Barati M, Tapak L. Prediction of helmet use behavior among motorcyclists based on theory of planned behavior. J Res Health Sci 2022; 22(4):e00564. doi: 10.34172/jrhs.2022.99 [Crossref] [ Google Scholar]
- Gonzalez RP, Cummings GR, Phelan HA, Harlin S, Mulekar M, Rodning CB. Increased rural vehicular mortality rates: roadways with higher speed limits or excessive vehicular speed?. J Trauma 2007; 63(6):1360-3. doi: 10.1097/TA.0b013e31815b83b3 [Crossref] [ Google Scholar]
- Kmet L, Brasher P, Macarthur C. A small area study of motor vehicle crash fatalities in Alberta, Canada. Accid Anal Prev 2003; 35(2):177-82. doi: 10.1016/s0001-4575(01)00101-4 [Crossref] [ Google Scholar]
- Jahanjoo F, Sadeghi-Bazargani H, Asghari-Jafarabadi M. Modeling road traffic fatalities in Iran’s six most populous provinces, 2015-2016. BMC Public Health 2022; 22(1):2234. doi: 10.1186/s12889-022-14678-5 [Crossref] [ Google Scholar]
- Abrari Vajari M, Aghabayk K, Sadeghian M, Shiwakoti N. A multinomial logit model of motorcycle crash severity at Australian intersections. J Safety Res 2020; 73:17-24. doi: 10.1016/j.jsr.2020.02.008 [Crossref] [ Google Scholar]
- Kaplan S, Prato CG. Risk factors associated with bus accident severity in the United States: a generalized ordered logit model. J Safety Res 2012; 43(3):171-80. doi: 10.1016/j.jsr.2012.05.003 [Crossref] [ Google Scholar]
- Khodabandelu S, Ghaemian N, Khafri S, Ezoji M, Khaleghi S. Development of a machine learning-based screening method for thyroid nodules classification by solving the imbalance challenge in thyroid nodules data. J Res Health Sci 2022; 22(3):e00555. doi: 10.34172/jrhs.2022.90 [Crossref] [ Google Scholar]
- Kim JK, Kim S, Ulfarsson GF, Porrello LA. Bicyclist injury severities in bicycle-motor vehicle accidents. Accid Anal Prev 2007; 39(2):238-51. doi: 10.1016/j.aap.2006.07.002 [Crossref] [ Google Scholar]
- Matthay EC, Hagan E, Gottlieb LM, Tan ML, Vlahov D, Adler NE. Alternative causal inference methods in population health research: evaluating tradeoffs and triangulating evidence. SSM Popul Health 2020; 10:100526. doi: 10.1016/j.ssmph.2019.100526 [Crossref] [ Google Scholar]
- Almeda N, García-Alonso CR, Salinas-Pérez JA, Gutiérrez-Colosía MR, Salvador-Carulla L. Causal modelling for supporting planning and management of mental health services and systems: a systematic review. Int J Environ Res Public Health 2019; 16(3):332. doi: 10.3390/ijerph16030332 [Crossref] [ Google Scholar]
- Santos K, Dias JP, Amado C. A literature review of machine learning algorithms for crash injury severity prediction. J Safety Res 2022; 80:254-69. doi: 10.1016/j.jsr.2021.12.007 [Crossref] [ Google Scholar]
- Hasanzadeh S, Asgharijafarabadi M, Sadeghi-Bazargani H. A hybrid of structural equation modeling and artificial neural networks to predict motorcyclists’ injuries: a conceptual model in a case-control study. Iran J Public Health 2020; 49(11):2194-204. doi: 10.18502/ijph.v49i11.4738 [Crossref] [ Google Scholar]
- Tun W, Wong JK, Ling SH. Hybrid random forest and support vector machine modeling for HVAC fault detection and diagnosis. Sensors (Basel) 2021; 21(24):8163. doi: 10.3390/s21248163 [Crossref] [ Google Scholar]
- Genuer R, Poggi J-M, Tuleau-Malot C. Variable selection using random forests. Pattern Recognit Lett 2010; 31(14):2225-36. doi: 10.1016/j.patrec.2010.03.014 [Crossref] [ Google Scholar]
- Orsi C, Marchetti P, Montomoli C, Morandi A. Car crashes: The effect of passenger presence and other factors on driver outcome. Saf Sci 2013; 57:35-43. doi: 10.1016/j.ssci.2013.01.017 [Crossref] [ Google Scholar]
- Peng H, Ma X, Chen F. Examining injury severity of pedestrians in vehicle-pedestrian crashes at mid-blocks using path analysis. Int J Environ Res Public Health 2020; 17(17):6170. doi: 10.3390/ijerph17176170 [Crossref] [ Google Scholar]
- Sadeghi-Bazargani H, Sadeghpour A, Lowery Wilson M, Ala A, Rahmani F. Developing a national integrated road traffic injury registry system: a conceptual model for a multidisciplinary setting. J Multidiscip Healthc 2020; 13:983-96. doi: 10.2147/jmdh.s262555 [Crossref] [ Google Scholar]
- Breiman L. Random forests. Mach Learn 2001; 45(1):5-32. doi: 10.1023/a:1010933404324 [Crossref] [ Google Scholar]
- Byrne BM. Structural Equation Modeling with AMOS: Basic Concepts, Applications, and Programming. 2nd ed. Lawrence Erlbaum Associates Publishers; 2010.
- Abdelrehim MG, Sadek RR, Mehany AS, Mohamed ES. A path analysis model examining factors affecting the caregiving burden experienced by the family caregivers of drug addicts in Egypt. J Res Health Sci 2022; 22(3):e00554. doi: 10.34172/jrhs.2022.89 [Crossref] [ Google Scholar]
- Schumacker RE, Lomax RG. A Beginner’s Guide to Structural Equation Modeling. 2nd ed. Lawrence Erlbaum Associates Publishers; 2004.
- Akoglu H. User’s guide to correlation coefficients. Turk J Emerg Med 2018; 18(3):91-3. doi: 10.1016/j.tjem.2018.08.001 [Crossref] [ Google Scholar]
- Kim JH. Multicollinearity and misleading statistical results. Korean J Anesthesiol 2019; 72(6):558-69. doi: 10.4097/kja.19087 [Crossref] [ Google Scholar]
- Tavakoli Kashani A, Rakhshani Moghadam M, Amirifar S. Factors affecting driver injury severity in fatigue and drowsiness accidents: a data mining framework. J Inj Violence Res 2022; 14(1):75-88. doi: 10.5249/jivr.v14i1.1679 [Crossref] [ Google Scholar]
- Othman S, Thomson R, Lannér G. Are driving and overtaking on right curves more dangerous than on left curves?. Ann Adv Automot Med 2010; 54:253-64. [ Google Scholar]
- Bjerre J, Kirkebjerg PG, Larsen LB. [Distribution of and changes in Danish traffic deaths]. Ugeskr Laeger 2006;168(18):1760-3. [Danish].
- Meteier Q, Capallera M, De Salis E, Widmer M, Angelini L, Abou Khaled O. Carrying a passenger and relaxation before driving: classification of young drivers’ physiological activation. Physiol Rep 2022; 10(10):e15229. doi: 10.14814/phy2.15229 [Crossref] [ Google Scholar]
- Mohammed AA, Ambak K, Mosa AM, Syamsunur D. A review of traffic accidents and related practices worldwide. Open Transp J 2019; 13(1):65-83. doi: 10.2174/1874447801913010065 [Crossref] [ Google Scholar]
- Goel G, Sachdeva SN. Analysis of road accidents on NH-1 between RD 98km to 148km. Perspect Sci (Neth) 2016; 8:392-4. doi: 10.1016/j.pisc.2016.04.086 [Crossref] [ Google Scholar]
- Wikipedia. Tehran. 2023. Available from: https://en.wikipedia.org/wiki/Tehran. Accessed 2023.
- Wang J, Parajuli S, Cherry CR, McDonald NC, Lyons T. Vulnerable road user safety and freight vehicles: a case study in North Carolina and Tennessee. Transp Res Interdiscip Perspect 2022; 15:100650. doi: 10.1016/j.trip.2022.100650 [Crossref] [ Google Scholar]
- Mohammadi M, Ansari Moghaddam A, Rad M, Hashemi Habybabady R, Tabasi MA. Seatbelt use and related factors among drivers involved in road crashes in Southeast Iran. Health Scope 2015; 4(4):e30782. doi: 10.17795/jhealthscope-30782 [Crossref] [ Google Scholar]
- Rezapour M, Ksaiabti K. Factors impacting the choice of seatbelt use, accounting for complexity of travelers’ behaviors. Future Transp 2022; 2(1):237-48. doi: 10.3390/futuretransp2010012 [Crossref] [ Google Scholar]
- Xiao Y. Analysis of the influencing factors of the unsafe driving behaviors of online car-hailing drivers in China. PLoS One 2020; 15(4):e0231175. doi: 10.1371/journal.pone.0231175 [Crossref] [ Google Scholar]
- Mekonnen TH, Tesfaye YA, Moges HG, Gebremedin RB. Factors associated with risky driving behaviors for road traffic crashes among professional car drivers in Bahirdar city, northwest Ethiopia, 2016: a cross-sectional study. Environ Health Prev Med 2019; 24(1):17. doi: 10.1186/s12199-019-0772-1 [Crossref] [ Google Scholar]
- Adavikottu A, Velaga NR. Analysis of factors influencing aggressive driver behavior and crash involvement. Traffic Inj Prev 2021; 22(Suppl 1):S21-S6. doi: 10.1080/15389588.2021.1965590 [Crossref] [ Google Scholar]
- Rice TM, Peek-Asa C, Kraus JF. Nighttime driving, passenger transport, and injury crash rates of young drivers. Inj Prev 2003; 9(3):245-50. doi: 10.1136/ip.9.3.245 [Crossref] [ Google Scholar]
- Winner H, Hakuli S, Wolf G. Handbuch Fahrerassistenzsysteme: Grundlagen, Komponenten und Systeme für Aktive Sicherheit und Komfort. Springer-Verlag; 2009.