J Res Health Sci. 18(2):e00412.
Original Article
A Comparison between Decision Tree and Random Forest in Determining the Risk Factors Associated with Type 2 Diabetes
Habibollah Esmaily 1, Maryam Tayefi 2, Hassan Doosti 3, Majid Ghayour-Mobarhan 4, 5, Hossein Nezami 6, Alireza Amirabadizadeh 7, *
Author information:
1Social Determinants of Health Research Center, Mashhad University of Medical Sciences, Mashhad, Iran
2Clinical Research Unit, Mashhad university of Medical Sciences, Mashhad, Iran
3Department of Statistics, Macquarie University, Sydney, NSW, Australia
4Biochemistry of Nutrition Research Center, School of Medicine, Mashhad University of Medical Sciences, Mashhad, Iran
5Department of Modern Sciences and Technologies, School of Medicine, Mashhad University of Medical Sciences, Mashhad, Iran
6Department of Basic Sciences, Faculty of Medicine, Gonabad University of Medical Sciences, Gonabad, Iran
7Medical Toxicology and Drug Abuse Research Center (MTDRC), Birjand University of Medical Sciences, Birjand, Iran
Abstract
Background: We aimed to identify the associated risk factors of type 2 diabetes mellitus (T2DM) using data mining approach, decision tree and random forest techniques using the Mashhad Stroke and Heart Atherosclerotic Disorders (MASHAD) Study program.
Study design: A cross-sectional study.
Methods: The MASHAD study started in 2010 and will continue until 2020. Two data mining tools, namely decision trees, and random forests, are used for predicting T2DM when some other characteristics are observed on 9528 subjects recruited from MASHAD database. This paper makes a comparison between these two models in terms of accuracy, sensitivity, specificity and the area under ROC curve.
Results: The prevalence rate of T2DM was 14% among these subjects. The decision tree model has 64.9% accuracy, 64.5% sensitivity, 66.8% specificity, and area under the ROC curve measuring 68.6%, while the random forest model has 71.1% accuracy, 71.3% sensitivity, 69.9% specificity, and area under the ROC curve measuring 77.3% respectively.
Conclusions: The random forest model, when used with demographic, clinical, and anthropometric and biochemical measurements, can provide a simple tool to identify associated risk factors for type 2 diabetes. Such identification can substantially use for managing the health policy to reduce the number of subjects with T2DM .
Keywords: Diabetes mellitus, Decision tree, Random forest, data mining, Iran
Copyright and License Information
© 2018 The Author(s); Published by Hamadan University of Medical Sciences.
This is an open-access article distributed under the terms of the Creative Commons Attribution License (http://creativecommons.org/licenses/by/4.0), which permits unrestricted use, distribution, and reproduction in any medium, provided the original work is properly cited.
Citation: Esmaily H, Tayefi M, Doosti H, Ghayour-Mobarhan M, Nezami H, Amirabadizadeh AR. A Comparison between Decision Tree and Random Forest in Determining the Risk Factors Associated with Type 2 Diabetes. J Res Health Sci. 2018; 18(2): e00412.
Introduction
Type 2 diabetes mellitus (T2DM) is a major public health problem and its mortality is increasing worldwide1,2. WHO predicts the prevalence of T2DM in Iran to be 6.8% in 2025, and this translates to 5215000 citizens of Iran3.
The results of Tehran cohort show the prevalence of type T2DM in Iran is 11%4 and Mashhad cohort states this prevalence as 14% 5.
T2DM is one of the most serious challenges for developing countries in the 21st century6,7. Diabetes has its roots in interactions between genetic, environmental and behavioral characteristics8,9. Cardiovascular diseases particularly are responsible for 80% of deaths due to T2DM10. Dominant possible risk factors in the development of T2DM are ethnicity, obesity, unhealthy diet, lack of physical activity, insulin resistance, and family history of diabetes11. Heart disease, stroke, blindness, kidney disease, and amputations are associated with diabetes 12. It is therefore essential to identify and diagnose individuals that run a high risk of T2DM 613.
In recent decades, different researchers in Iran have used data mining methods such as decision tree, neural network, support vector machine, random forest to predict the associated risk factors of T2DM5,14. One reason for not using classical statistical method is the number of predictors which the classical methods cannot select them conveniently. These two models, decision tree, and random forest are two of classification models and there are not so many studies in this regard.
Data mining is a new collection of statistical methods used to characteristics significantly associated with T2DM15,16. Data mining can discover new factors and also find relationships among factors that can reveal patterns and develop predictions based on new factors associated with T2DM17,18.
There are not many studies regarding associated risk factors of T2DM using data mining algorithms in Eastern Iran until yet. In this study, we developed the predicting model to identify associated risk factors of T2DM as a supplement in screening and public health in Eastern Iran.
Methods
Participants
The MASHAD study started in 2010 and will continue until 2020. The city of Mashhad is located in the north-eastern part of Iran. The total population of Mashhad was estimated using the national Iranian census of 2006 so the sample size was determined accordingly. Participants were enrolled from three regions of Mashhad. Each region was divided into nine sites centered at Mashhad Healthcare Center divisions. Overall, 9528 subjects were enrolled as a part of MASHAD study 19.
This protocol was approved by the Ethics Committee of MUMS, and an informed written consent was obtained from every participant.
Demographic characteristics such as age, gender, marital status, education, cigarette smoking habit, physical activity level (PAL), family history of diabetes (FHD) and depression score were collected from all the subjects. The Beck’s depression inventory-II (BDI-II) was used to evaluate the depression. Anthropometric information including weight, height, waist and hip circumference were obtained. Systolic and diastolic blood pressures were measured as described earlier 19. Biochemical parameters included: fasted serum triglycerides (TGs), total cholesterol (TC), HDL-cholesterol and LDL-cholesterol, fasting blood glucose (FBG) and hs-CRP were measured as previously described19. Diagnosed T2DM was identified based fasting blood glucose (FBG) ≥126 mg/dl 20.
Input variables
The final data contains 9528 records and 18 variables, divided into 17 predictor variables and one outcome or target variable. The target variable has two possible states, namely occurrence of T2DM or no occurrence of T2DM. Demographic characteristics included age, gender, body mass index (BMI), marital status, level of education and biochemical markers, physical activity level (PAL), cigarette smoking habits, family history of diabetes (FHD) and depression score were considered as predictors (Table 1-2).
Table 1.
Comparison of baseline characteristics between diabetes and non-diabetes groups
|
Variables
|
Number
|
Percent
|
Number
|
Percent
|
P
value
|
| Sex |
|
|
|
|
0.040 |
| Male |
518 |
38.1 |
3277 |
40.1 |
|
| Female |
843 |
61.9 |
4890 |
59.9 |
|
| Educational level |
|
|
|
0.001 |
| High |
109 |
8.0 |
936 |
11.5 |
|
| Moderate |
374 |
27.5 |
2912 |
35.7 |
|
| Low |
878 |
64.5 |
4319 |
52.9 |
|
| Occupational status |
|
|
|
0.001 |
| Employed |
400 |
29.4 |
3114 |
38.1 |
|
| Retired |
178 |
13.1 |
755 |
9.2 |
|
| Students |
0 |
0.0 |
20 |
0.2 |
|
| Un employed |
783 |
57.5 |
4278 |
52.4 |
|
| Marital status |
|
|
|
|
0.001 |
| Married |
1239 |
91.0 |
7636 |
93.5 |
|
| Single |
5 |
0.4 |
54 |
0.7 |
|
| Widow |
96 |
7.1 |
366 |
4.5 |
|
| Divorced |
21 |
1.5 |
111 |
1.4 |
|
| Smoking status |
|
|
|
|
0.050 |
| Yes |
272 |
20.0 |
1775 |
21.7 |
|
| No |
1089 |
80.0 |
6392 |
78.3 |
|
| Family history of diabetes |
|
|
|
0.001 |
| Yes |
647 |
47.5 |
1994 |
24.4 |
|
| No |
714 |
52.5 |
6173 |
75.6 |
|
| Depression |
|
|
|
|
0.001 |
| Yes |
461 |
33.9 |
2226 |
27.3 |
|
| No |
900 |
66.1 |
5941 |
27.7 |
|
Table 2.
Comparison of biochemical markers between diabetic and non-diabetic groups
|
|
Diabetes
|
Non-diabetes
|
|
|
Variables
|
Mean
|
SD
|
Mead
|
SD
|
P
value
|
| Systolic blood pressure (mmHg) |
128.8 |
18.4 |
121.1 |
18.2 |
0.001 |
| Diastolic blood pressure (mmHg) |
81.4 |
10.4 |
78.9 |
11.1 |
0.001 |
| Total cholesterol (mg/dl) |
205.5 |
46.3 |
189.7 |
37.8 |
0.001 |
| Low-density lipoprotein (mg/dl) |
122.5 |
39.1 |
115.7 |
34.6 |
0.001 |
| High-density lipoprotein (mg/dl) |
41.8 |
9.6 |
42.7 |
9.9 |
0.004 |
| Triglycerides (mg/dl) |
160.0 |
122.0 |
117.0 |
83.0 |
0.001 |
| High-sensitivity -CRP |
2.7 |
4.34 |
1.6 |
2.3 |
0.002 |
Decision tree model
A decision tree is a non-parametric method named according to the nature of target variable. It is called a classification tree if the target variable is categorical and a regression tree if the target variable is continuous. The purpose of a decision tree is to develop a predictive model in terms of predictor variables. The tree is formed by successively dividing data according to one of the predictor variables. A decision tree consists of three types of nodes: root node, internal nodes, and leaf nodes21-23. Decision tree algorithms develop splitting criteria at internal nodes to from the tree. The split of a node attempts to minimize the impurity of the node. If a split is unable to achieve any improvement in terms of reducing impurity, the node is not split and is declared as a leaf node. If a split is able to reduce impurity, then the split providing the maximum reduction in impurity is selected and two branches are formed, forming two new nodes. The popular splitting criteria are information Gain, Gini index and gain ratio. CART is one of the decision tree algorithms that construct a binary tree using Gini index for selecting the splitting variable at every internal node. The Gini index at a node D is given by
where pi is the probability that an observation in D belongs to the class Ci and is estimated by |Ci, D|/|D| 24,25. The sum is taken over them possible classes. The tree begins with all observations forming the root node and successive splits determine the order of importance of the predictor variables.
Random Forest
Random forest is an ensemble learning method. It generates many classification trees by selecting subsets of the given dataset and selecting subsets of predictor variables randomly, finally aggregating the results of all models to obtain a random forest. Multiple classification trees are obtained from bootstrap samples in order to arrive at the final “majority” classification rules. The tree training parameters used in the present study are (i) ntree=500, the number of trees generated (ii) ntry=17, the number of predictor variables used in each tree, and (iii) node size=5, the minimum number of observations in a leaf node. Supervised machine learning algorithms divide the data into two parts, namely training data and test data.
One of the most important features of random forest and decision tree is the output of the variable importance. Variable importance measures the degree of association between a given variable and the classification result. Random forest and decision tree have four measures for the variable importance: raw importance score for class 0, raw importance score for class 1, decrease in accuracy and the Gini index26.
Statistical analyses were performed using R packages rpart (for decision trees), random Forest (for random forest) and caret. The complete sample contained 1361 individuals with T2DM and the remaining 8167 individuals without T2DM. The present study adopted a 10‐fold cross validation method to evaluate decision tree and random forest model. The 10‐fold cross validation method involves randomly separating the acquired data sets into 10 data sets that are equal in sample size. The decision tree and random forest models are constructed on the basis of a training data set. The rest of the nine data sets were used as testing data for verifying model effectiveness. Ten repeated empirical tests were conducted, where each subset was used as the test data. The bootstrap (500 replications) optimism-corrected area under the receiver operating characteristic curve (ROC) was estimated using R software.
The decision tree developed on the training data was used to obtain the splitting criteria for different nodes and was then applied to observation in the test data. The resulting tree is used to measure sensitivity, specificity, and accuracy of the model. If values of these measures are high for training data and lower for test data, it is considered as a case of overfitting. These measures must be obtained on training data as well as on test data in order to establish validity of the model. The models reported in this paper have been validated and results on test data are reported here.
Models are evaluated by constructing the confusion matrix for test data. In addition, accuracy, sensitivity, and specificity are also measured for each model. Accuracy, sensitivity, and specificity of a classification model are defined as follows 27.
Here TP, TN, FP, and FN are truly positive, true negative, false positive and false negative respectively.
The receiver operating characteristic (ROC) curve is the plot that displays the full picture of trade-off between the sensitivity and (1- specificity) across a series of cutoff points. Area under the ROC curve is considered as an effective measure of inherent validity of a diagnostic test.
Results
Anthropometric and biochemical features are summarized in Table 1 and 2, respectively. In general, 1361 (14.3%) people had T2DM. Of 1361 diabetic individuals, 843 (61.9%) were female, 1239 (91%) were married, and 783 (57.5%) were unemployed. Subjects with T2DM showed significantly higher systolic blood pressure, triglyceride, hs-CRP, diastolic blood pressure, serum total cholesterol, and LDL-cholesterol, whereas they showed significantly lower HDL-cholesterol than subjects without T2DM. The mean age of diabetic individuals was higher than non-diabetic individuals (52.01 ±7.2 vs 47.70 ±8.1, P <0.001). The mean BMI of diabetic patients was 28.78 ±4.4 and for non-diabetic persons was 27.76±4.7. The results of the independent t -test showed that the BMI in diabetics was significantly higher than non - diabetic people (P <0.001). The mean PAL of diabetic individuals was lower than non-diabetic individuals (1.59 ±0.86 vs 1.60 ±0.64, P =0.040).
Based on the results of the random forest model, TG, hs-CRP, SBP, LDL, TC, FHD, age, BMI, and PAL were the most important risk factors related to T2DM (Figure 1). In a subgroup with TG>204.5 and hs-CRP≤1.32 and occupation=employment, 79.2% was the probability of not occurrence of T2DM. In the subgroup with TG>204.5 and hs-CRP<1.32 and occupation=unemployment and hs-CRP>4.66, the probability of occurrence of T2DM is 90% (Table 3).
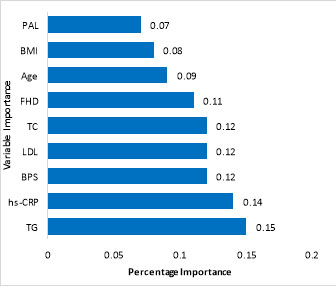
Figure 1.
The importance of input variables in Random Forest model. X-axis shows the percentage of importance and the Y-axis represents the variables’ importance
.
The importance of input variables in Random Forest model. X-axis shows the percentage of importance and the Y-axis represents the variables’ importance
Based on the results of the decision tree model, FHD, age, TG, SBP, hs-CRP, BMI, and DBP were the most important risk factors related to T2DM. Figure 2 shows the complete tree produced by CART. The decision tree showed that in a subgroup with FHD=no and TG<184, 92% is the probability of not occurrence of T2DM. In another subgroup, if FHD=yes, age<48 and SBP<140, the T2DM will not occur with probability of 87% (Table 3).
Table 3.
The rules extracted through random forest and decision tree models
|
Random forest model
|
R1: IF TG>204.5 and hs-CRP≤1.32 and occupation=employment, THEN class: person without diabetes (187/236 or 79.2%)
R2: IF TG>204.5 and hs-CRP<1.32 and occupation=retired and TC≤257, THEN class: person without diabetes (43/72 or 59.7%)
R3: IF TG>204.5 and hs-CRP<1.32 and occupation=retired and TC>257 and LDL≤110.9, THEN class: person without diabetes (21/23 or 91.3%)
R4: IF TG>204.5 and hs-CRP<1.32 and occupation=retired and TC>257 and LDL>110.9, THEN class: person with diabetes (5/9 or 55.5%)
R5: IF TG>204.5 and hs-CRP<1.32 and occupation=unemployment and hs-CRP>4.66, THEN class: person with diabetes (9/10 or 90%)
R6: IF TG>204.5 and hs-CRP<1.32 and occupation=unemployment and hs-CRP≤4.66 and BPD<57.9, THEN class: person without diabetes (138/199 or 69.3%)
R7: IF TG>204.5 and hs-CRP<1.32 and occupation=unemployment and hs-CRP≤4.66 and BPD>57.9 and FHD=yes, THEN class: person with diabetes (14/16 or 87.5%)
R8: IF TG>204.5 and hs-CRP<1.32 and occupation=unemployment and hs-CRP≤4.66 and BPD>57.9 and FHD=no, THEN class: person without diabetes (25/32 or 78.1%)
R9: IF TG≤204.5 and hs-CRP>1.81 and age≤46.10, THEN class: person without diabetes (569/753 or 79.1%)
R10: IF TG≤204.5 and hs-CRP>1.81 and age>46.10 and HDL>67.5 and TG>227 and BMI> 24.61, THEN class: person with diabetes (8/9 or 88.8%)
R11: IF TG≤204.5 and hs-CRP>1.81 and age>46.10 and HDL>67.5 and TG>227 and BMI≤24.61, THEN class: person without diabetes (5/9 or 55.5%)
R12: IF TG≤204.5 and hs-CRP>1.81 and age>46.10 and HDL>67.5 and TG≤227, THEN class: person without diabetes (11/12 or 91.6%)
R13: IF TG≤204.5 and hs-CRP>1.81 and age>46.10 and HDL≤67.5 and PAL>2.18, THEN class: person without diabetes (129/136 or 94.8%)
R14: IF TG≤204.5 and hs-CRP>1.81 and age>46.10 and HDL≤67.5 and PAL≤2.18 and BPS≤128.16, THEN class: person without diabetes (4/8 or 50%)
R15: IF TG≤204.5 and hs-CRP>1.81 and age>46.10 and HDL≤67.5 and PAL≤2.18 and BPS>128.16, THEN class: person with diabetes (8/12 or 66.6%) |
|
Decision tree model
|
R1: IF FHD=no and TG<184, THEN class: person without diabetes (3604/3921 or 92%)
R2: IF FHD=no, TG≥184 and age<48, THEN class: person without diabetes (340/386 or 88%)
R3: IF FHD=no, TG≥184, age≥48 and hs-CRP<2.2, THEN class: person without diabetes (272/307 or 88%)
R4: IF FHD=no, TG≥184, age≥48 and hs-CRP≥2.2, THEN class: person with diabetes (100/198 or 51%)
R5: IF FHD=yes, age<48 and SBP<140, THEN class: person without diabetes (809/894 or 90%)
R6: IF FHD=yes, age<48 and SBP≥140, THEN class: person with diabetes (72/133 or 54%)
R7: IF FHD=yes, age≥48, SBP≥130, DBP<81 and PAL≥1.6, THEN class: person without diabetes (16/29 or 55%)
R8: IF FHD=yes, age≥48, SBP≥130, DBP<81 and PAL<1.6, THEN class: person with diabetes (37/47 or 79%)
R9: IF FHD=yes, age≥48, SBP≥130, DBP≥81, HDL<29, THEN class: person with diabetes (11/13 or 85%)
R10: IF FHD=yes, age≥48, SBP≥130, DBP≥81, HDL≥29, LDL<148 and hs-CRP<6.8, THEN class: person without diabetes (96/138 or 70%)
R11: IF FHD=yes, age≥48, SBP≥130, DBP≥81, HDL≥29, LDL<148 and hs-CRP≥6.8, THEN class: person with diabetes (17/33 or 52%)
R12: IF FHD=yes, age≥48, SBP≥130, DBP≥81, HDL≥29, LDL≥148 and occupation=employed, THEN class: person without diabetes (7/9 or 78%)
R13: IF FHD=yes, age≥48, SBP≥130, DBP≥81, HDL≥29, LDL≥148 and occupation=other, THEN class: person with diabetes (34/58 or 59%)
R14: IF FHD=yes, age≥48, SBP<130, BMI<23, THEN class: person without diabetes (324/442 or 73%)
R15: IF FHD=yes, age≥48, SBP<130, BMI≥23 and education=low, THEN class: person with diabetes (15/20 or 75%)
R16: IF FHD=yes, age≥48, SBP<130, BMI≥23 and education=high &moderate, THEN class: person without diabetes (15/26 or 58%) |
Sensitivity (95% CI) of decision tree and random forest model are, respectively, 64.5% (62.9, 86.7) and 71.3% (65.3, 74.4), and their specificity (95% CI) rate are 66.8% (58.3, 70.8) and 69.9% (65.4, 77.1) respectively, and their accuracy (95% CI) are 64.9% (63.6, 80.4) and 71.1% (66.8, 73.5). We used the area under curve ±standard error (95% CI) to compare these two models. The related value in the case of decision tree amounted to 68.6 ±1.39 (65.8-71.3) and 77.3±0.001 (73.8, 78.8) for the random forest model (Figure 3). The decision tree and random forest model (D=6.53, P <0.001).
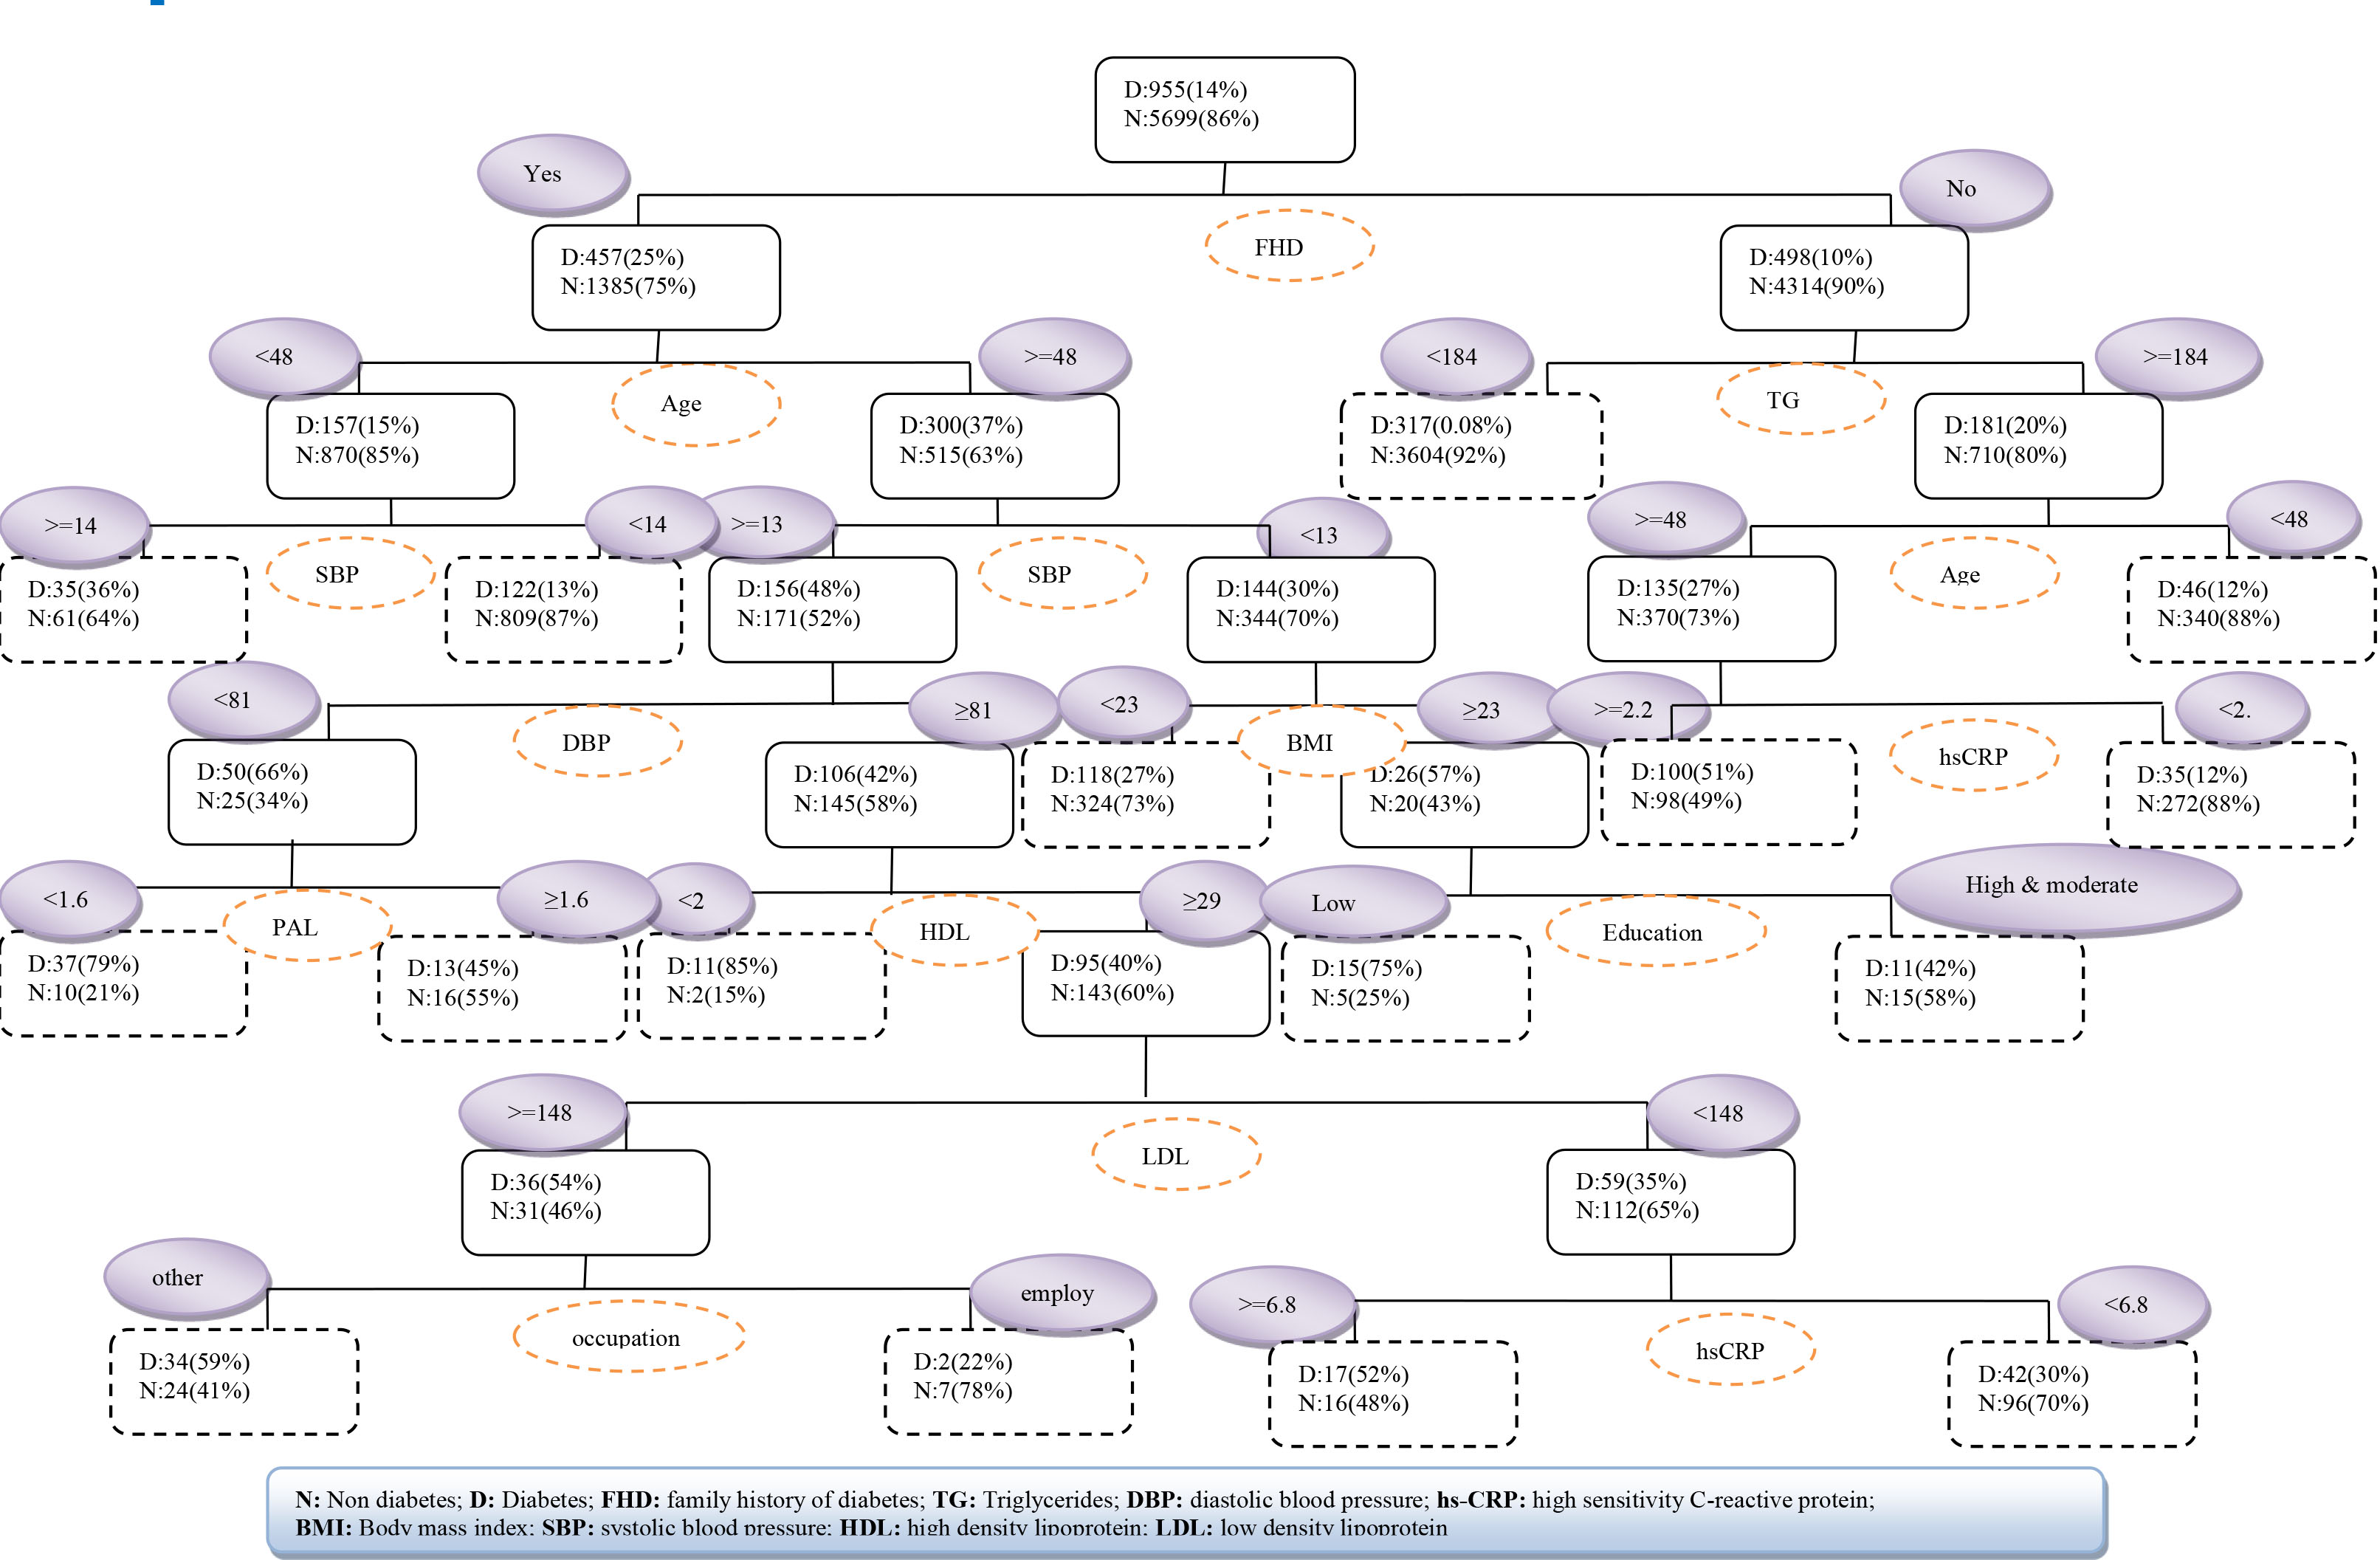
Figure 2.
The decision tree CART with training dataset
.
The decision tree CART with training dataset
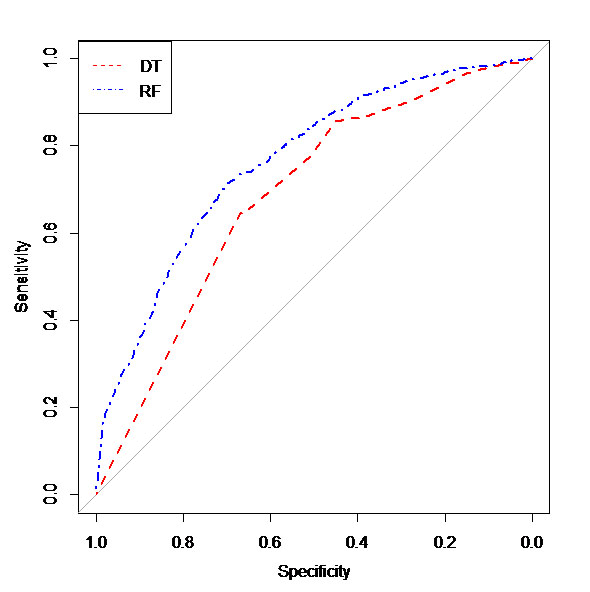
Figure 3.
Roc curve of the DT and RF model in testing dataset
.
Roc curve of the DT and RF model in testing dataset
Discussion
We developed a prediction model based on cross-sectional study to predict risk factors of T2DM according to decision tree and random forest models.
The random forest model showed that TG, hs-CRP, SBP, LDL, TC, FHD, age, BMI, and PAL were strongly associated with T2DM. The decision tree model found FHD, age, TG, SBP, hs-CRP, BMI, and DBP were strongly associated with occurrence of T2DM. Putting the two results together, TG, FHD, hs-CRP, SBP, and BMI are common associated risk factors of T2DM in the two models. In a cohort study by using a decision tree, TG, family history of T2DM, BMI, SBP, education level and occupation were the associated risk factors of T2DM4.
Decision tree algorithm is a classification model based on different predictor variables and is widely being used in medicine28-30. RF creates multiple classification and regression (CART) trees, each trained on a bootstrap sample of the original training data and searches across a randomly selected subset of input variables to determine the split31. The variables such as family history of diabetes, age, triglycerides, LDL-cholesterol, body mass index, and physical activity level have already been identified as important associated risk factors of diabetes32-34. The present study has found hs-CRP as an important associated risk factor of T2DM, but it has not been reported so far 28,33.
The results of our study showed that family history of diabetes and triglycerides were the most important risk factors related to T2DM in the decision tree and random forest models. In other studies also, family history of diabetes and TG were the most important associated risk factors for T2DM4,30.
Decision trees are one of the easiest tools to decision systems and easy to understand. Decision trees can easily convert to if-then rules. Programs based on these rules can be made and used on personal computers for decision analyses, used easily with physicians and health care personnel to conclude the outcomes 4,35-38.
In this study, comparison of decision tree and random forest models showed that sensitivity and specificity values of random forest were higher than decision tree which was inconsistency with previous studies 3139. On the other hand, sensitivity of C4.5 algorithm was higher than random forest, but specificity of random forest was higher than decision tree (C4.5)39. The reason for being difference between sensitivity of them is using different algorithm.
The ROC curve is a technique to visualize, organize, and choose classification based on the performance of the classification. The area under the curve (AUC) is an index of which model performs better and has a high level of accuracy. This index, which compares the performance of true positive and false positive of two different decision extremes, is often used to evaluate the predictive accuracy of classification models40.
In the current study, the AUC of random forest of testing dataset was significantly higher than decision tree which was consistent with previous studies 31,39. Random forest model is an accurate model for investigation of novel predictor markers, which is in line with previous14,31.
The strength of the study lies in its large sample size that makes it applicable to general population. One potential limitation of this study is that it is based on a cross-sectional data and cannot obtain results obtained from longitudinal or cohort data.
Conclusions
Random forest models can provide good prediction models due to their efficacy and sensitivity and specificity. According to random forest model, TG and hs-CRP are the most important associated risk factors for T2DM. This study has also identified some new risk factors associated with T2DM indicating the need for further evaluation of clinical applicability of this model.
Acknowledgements
This study was financially supported by the Biochemistry of Nutrition Research Center of Mashhad University of Medical Sciences, Mashhad, Iran.
Conflict of interest statement
The authors declare that there is no conflict of interest.
Funding
This study was supported by Mashhad university of medical sciences.
Highlights
-
Based on the RF model TG, hs-CRP, SBP, and FHD are the most important associated risk factors for T2DM.
-
Based on the DT model FHD, TG, age, and hs-CRP are the most important associated risk factors for T2DM.
-
RF model demonstrated a better discriminatory power compared with DT model.
References
- Hu D, Fu P, Xie J, Chen C-S, Yu D, Whelton PK. Increasing prevalence and low awareness, treatment and control of diabetes mellitus among Chinese adults: the InterASIA study. Diabetes Res Clin Pract 2008; 81(2):250-7. [ Google Scholar]
- Nathan DM, Buse JB, Davidson MB, Ferrannini E, Holman RR, Sherwin R. Medical management of hyperglycemia in type 2 diabetes: a consensus algorithm for the initiation and adjustment of therapy a consensus statement of the American Diabetes Association and the European Association for the Study of Diabetes. Diabetes Care 2009; 32(1):193-203. [ Google Scholar]
-
Farzianpour F, Fouroshani AR, Hosseini S, Hosseini S, Hosseini SS. A comparison between two educational methods of on diabetic patients in Iran. 2nd International conference on economic, Education and management; June 1 - June 2; Shanghai 2012.
- Ramezankhani A, Pournik O, Shahrabi J, Khalili D, Azizi F, Hadaegh F. Applying decision tree for identification of a low risk population for type 2 diabetes Tehran Lipid and Glucose Study. Diabetes Res Clin Pract 2014; 105(3):391-8. [ Google Scholar]
-
Esmaeily H, Tayefi M, Ghayour-Mobarhan M, Amirabadizadeh A. Comparing Three Data Mining Algorithms for Identifying the Associated Risk Factors of Type 2 Diabetes. Iran Biomed J. 2018 (In press).
- Whiting DR, Guariguata L, Weil C, Shaw J. IDF diabetes atlas: global estimates of the prevalence of diabetes for 2011 and 2030. Diabetes Res Clin Pract 2011; 94(3):311-21. [ Google Scholar]
- Hemmati M, Zohoori E, Mehrpour O, Karamian M, Asghari S, Zarban A. Anti-atherogenic potential of jujube, saffron and barberry: Anti-diabetic and antioxidant actions. Excli J 2015; 14(4):908-15. [ Google Scholar]
- Booth GL, Kapral MK, Fung K, Tu JV. Relation between age and cardiovascular disease in men and women with diabetes compared with non-diabetic people: a population-based retrospective cohort study. The Lancet 2006; 368(9529):29-36. [ Google Scholar]
- Alberti KGM, Zimmet P, Shaw J. International Diabetes Federation: a consensus on Type 2 diabetes prevention. Diabet Med 2007; 24(5):451-63. [ Google Scholar]
- Investigators HOPES. Effects of ramipril on cardiovascular and microvascular outcomes in people with diabetes mellitus: results of the HOPE study and MICRO-HOPE substudy. The Lancet 2000; 355(9200):253-9. [ Google Scholar]
- Barr EL, Zimmet PZ, Welborn TA, Jolley D, Magliano DJ, Dunstan DW. Risk of cardiovascular and all-cause mortality in individuals with diabetes mellitus, impaired fasting glucose, and impaired glucose tolerance The Australian Diabetes, Obesity, and Lifestyle Study (AusDiab). Circulation 2007; 116(2):151-7. [ Google Scholar]
- Pi-Sunyer FX. How effective are lifestyle changes in the prevention of type 2 diabetes mellitus?. Nutr Rev 2007; 65(3):101-10. [ Google Scholar]
- Norris SL, Kansagara D, Bougatsos C, Fu R. Screening adults for type 2 diabetes: A review of the evidence for the US preventive services task force. Ann Intern Med 2008; 148(11):855-68. [ Google Scholar]
- Tapak L, Mahjub H, Hamidi O, Poorolajal J. Real-data comparison of data mining methods in prediction of diabetes in Iran. Healthc Inform Res 2013; 19(3):177-85. [ Google Scholar]
- Chen HY, Chuang CH, Yang YJ, Wu TP. Exploring the risk factors of preterm birth using data mining. Expert Syst Appl 2011; 38(5):5384-7. [ Google Scholar]
- Aslan K, Bozdemir H, Sahin C, Noyan Ogulata S. Can neural network able to estimate the prognosis of epilepsy patients accorrding to risk factors?. J Med Syst 2010; 34(4):541-50. [ Google Scholar]
- Bellazzi R, Zupan B. Predictive data mining in clinical medicine: Current issues and guidelines. Int J Med Inform 2008; 77(2):81-97. [ Google Scholar]
- Delen D, Walker G, Kadam A. Predicting breast cancer survivability: A comparison of three data mining methods. Artif Intell Med 2005; 34(2):113-27. [ Google Scholar]
- Ghayour-Mobarhan M, Moohebati M, Esmaily H, Ebrahimi M, Parizadeh SMR, Heidari-Bakavoli AR. Mashhad stroke and heart atherosclerotic disorder (MASHAD) study: design, baseline characteristics and 10-year cardiovascular risk estimation. Int J Public Health 2015; 60(5):561-72. [ Google Scholar]
- American Diabetes Association. Report of the expert committee on the diagnosis and classification of diabetes mellitus. Diabetes care 1997; 20:1183-97. [ Google Scholar]
- Fawcett T. An introduction to ROC analysis. Pattern Recognit Lett 2006; 27(8):861-74. [ Google Scholar]
-
Shi G. Data Mining and Knowledge Discovery for Geoscientists. Oxford: Elsevier; 2013.
- Tayefi M, Tajfard M, Saffar S, Hanachi P, Amirabadizadeh AR, Esmaeily H. hs-CRP is strongly associated with coronary heart disease (CHD): A data mining approach using decision tree algorithm. Comput Methods Programs Biomed 2017; 141:105-9. [ Google Scholar]
-
Han J, Kamber M, Pei J. Data mining: concepts and techniques: concepts and techniques. 3rd ed Elsevier; 2011.
- Tayefi M, Esmaeili H, Saberi Karimian M, Amirabadi Zadeh A, Ebrahimi M, Safarian M. The application of a decision tree to establish the parameters associated with hypertension. Comput Methods Programs Biomed 2017; 139:83-91. [ Google Scholar]
- John Lu ZQ. The elements of statistical learning: data mining, inference, and prediction. J R Stat Soc Series A Stat in Sco 2010; 173(3):693-4. [ Google Scholar]
- Lavrač N. Selected techniques for data mining in medicine. Artif Intell Med 1999; 16(1):3-23. [ Google Scholar]
-
Fayyad, UM, Wierse A, Grinstein, GG. Information visualization in data mining and knowledge discovery. Morgan Kaufmann. 2002.
- Kammerer JS, McNabb SJ, Becerra JE, Rosenblum L, Shang N, Iademarco MF. Tuberculosis transmission in nontraditional settings: a decision-tree approach. Am J Prev Med 2005; 28(2):201-7. [ Google Scholar]
- Amirabadizadeh A, Nezami H, Vaughn MG, Nakhaee S, Mehrpour O. Identifying Risk Factors for Drug Use in an Iranian Treatment Sample: A Prediction Approach Using Decision Trees. Subst Use Misuse 2018; 53(6):1030-40. [ Google Scholar]
- Maroco J, Silva D, Rodrigues A, Guerreiro M, Santana I, de Mendonça A. Data mining methods in the prediction of Dementia: A real-data comparison of the accuracy, sensitivity and specificity of linear discriminant analysis, logistic regression, neural networks, support vector machines, classification trees and random forests. BMC Res Notes 2011; 4(1):299-313. [ Google Scholar]
- Abbasi A, Peelen LM, Corpeleijn E, van der Schouw YT, Stolk RP, Spijkerman AM. Prediction models for risk of developing type 2 diabetes: systematic literature search and independent external validation study. BMJ 2012; 345:e5900. [ Google Scholar]
- Guariguata L, Whiting D, Hambleton I, Beagley J, Linnenkamp U, Shaw J. Global estimates of diabetes prevalence for 2013 and projections for 2035. Diabetes Res Clin Pract 2014; 103(2):137-49. [ Google Scholar]
- Dallo FJ, Weller SC. Effectiveness of diabetes mellitus screening recommendations. Proc Natl Acad Sci U S A 2003; 100(18):10574-9. [ Google Scholar]
- Podgorelec V, Kokol P, Stiglic B, Rozman I. Decision trees: an overview and their use in medicine. J Med Syst 2002; 26(5):445-63. [ Google Scholar]
-
Musen MA, Middleton B, Greenes RA. Clinical decision-support systems. Springer Science+ Business Media; 2014.
- Wang C-J, Li Y-Q, Wang L, Li L-L, Guo Y-R, Zhang L-Y. Development and evaluation of a simple and effective prediction approach for identifying those at high risk of dyslipidemia in rural adult residents. PLoS One 2012; 7(8):e43834. [ Google Scholar]
- Tayefi M, Saberi-Karimian M, Esmaeili H, Zadeh AA, Ebrahimi M, Mohebati M. Evaluating of associated risk factors of metabolic syndrome by using decision tree. Comp Clin Path 2018; 27(1):215-23. [ Google Scholar]
- Ge G, Wong GW. Classification of premalignant pancreatic cancer mass-spectrometry data using decision tree ensembles. BMC Bioinformatics 2008; 9:275-87. [ Google Scholar]
- Ke W-s, Hwang Y, Lin E. Pharmacogenomics of drug efficacy in the interferon treatment of chronic hepatitis C using classification algorithms. Adv Appl Bioinform Chem 2010; 3:39-44. [ Google Scholar]