J Res Health Sci.18(3) :e00424.
Original Article
Economic Inequality in Outpatient Healthcare Utilization: The Case of Iran
Sajad Vahedi 1, Aziz Rezapour 2, *, Abolfazl Mohammadbeig 3, Ardeshir Khosravi 4
Author information:
1 Department of Health Economics, School of Health Management and Information Sciences, Iran University of Medical Sciences, Tehran, Iran
2 Health Management and Economics Research Center, Iran University of Medical Sciences, Tehran
3 Research Center for Environmental Pollutants, Department of Epidemiology and Biostatistics, Faculty of Health, Qom University of Medical Sciences, Qom, Iran
4 Deputy of Public Health, Ministry of Health and Medical Education, Tehran, Iran
*
Correspondence:
Aziz Rezapour (PhD) Tel: +98 21 88794301 Fax: +98 21 88883334 E-mail:
rezapoor_a57@yahoo.com
Abstract
Background: One of important goals of any health system is to reduce healthcare inequalities in its jurisdiction. We aimed to track economic inequality in outpatient health care utilization after the healthcare transformation plan in Iran.
Study Design: A cross-sectional study.
Methods: The data obtained from the Iranian healthcare utilization household survey conducted in 2015. The inequality in health care utilization was assessed through concentrating index, concentration curve, and odds ratio. GIS analysis also was used to show provincial concentration index in the map of Iran. The analysis was performed on more than 14000 subjects aged 15 yr or higher reported outpatient health care service’s needs.
Results: The richest to poorest odds ratio of outpatient health care utilization was 1.14 (95%CI: 1.11, 1.17). The concentration index of outpatient healthcare utilization was obtained 0.094 (95%CI: 0.77, 0.11). Although the concentration indices of rural and urban residents were significantly different, there was no significant difference between male and female subject. Provincial and GIS analysis showed that inequality in outpatient healthcare utilization was spatially distributed in Iran.
Conclusions: Findings of current study indicate that after the healthcare transformation plan, economic inequality in outpatient healthcare utilization still were pro-rich in Iran as a whole and in some of its provinces.
Keywords: Healthcare disparities, Health services, Spatial analysis, Iran
Copyright and License Information
© 2018 The Author(s); Published by Hamadan University of Medical Sciences.
This is an open-access article distributed under the terms of the Creative Commons Attribution License (http://creativecommons.org/licenses/by/4.0), which permits unrestricted use, distribution, and reproduction in any medium, provided the original work is properly cited.
Citation: Vahedi S, Rezapour A, Mohammadbeigi A, Khosravi A. Economic Inequality in Outpatient Healthcare Utilization: The Case of Iran. J Res Health Sci. 2018; 18(3): e00424
Introduction
Good health consists of the best attainable average and the smallest feasible differences among individuals and groups
1
. Hence, one of the important goals of any health system is to reduce healthcare inequalities in its jurisdiction
1,2
. Unfortunately, despite dramatic improvement in access to health care services, there are major disparities in healthcare utilization between different socioeconomic groups
3
. These immoral inequalities not only seen in low-and-middle income countries (LMICs), but also some high-income countries are faced with different degrees of healthcare utilization inequality
4
.
Decrease in health outcomes and increase in health inequity are the true costs of unequal access to healthcare services. This condition could have significant side-effects on the productivity of labor market and decrease gross domestic product (GDP)
5
. Generally, inequality in access to healthcare services could increase both mortality and morbidity
6
. Therefore, universal health coverage (UHC) is extremely recommended as a scheme, regardless of socioeconomic and cultural background, to increase the access to necessary health care services
7
.
Iran is a middle-income country with mixed economy that spends about 7% of its GDP on healthcare8. Previous nationa
14
and subnational
3
studies, showed that Iran faced considerable health care utilization inequality. In spite of health equity issues that reflected in the upstream documents
9
and several healthcare reforms and plans such as family physician program
10
as well as health sector transformation plan (HTP)
11
, there are the worrying concerns about utilization of necessary health care services by disadvantaged groups. Thus, the purpose of this study was to track inequality in outpatient healthcare services in Iran and among its provinces after HTP by using recent healthcare utilization survey.
Methods
Data
Data were obtained from national survey entitled Iranian healthcare utilization household survey (IrUHS) that was conducted by the National Institute Health Research and Statistical Center of Iran in 201512. The IrMIDHS aimed to collect and prepare valid nation-wide data on health and population indices in order to assess the status of health care services and the impact of social indicators on utilization of health care services by Iranians in the health sector of Iran
3
. Multi-stage proportional stratified cluster sampling was used in this survey. However, due to differences in population size of Iranian provinces and their districts, the proportion of each district was determined from total sample size. Subsequently, random samples of clusters in each district were selected and weighted according to the rural and urban population within each region. Each cluster consisted of 10 households
12
.
The IrUHS consist of two questionnaires; household (41 questions) and healthcare utilization. Healthcare utilization questionnaire consisted of two sections that were about utilization of outpatient (38 questions) and inpatient (38 questions) healthcare services by household members. These questionnaires were completed by conducting face-to-face interviews with household members. Overal 22470 household questionnaires and 18984 outpatient section questionnaire were completed. To assess the economic inequalities in health care utilization (outpatient services only) and due to missing data, we excluded people under 15 year. Accordingly, analysis was done for 14785 subjects.
Measurements of economic Status
The IrUHS have no observation about income or expenditure level; hence we used the wealth index which created through the principal component analysis statistical method. This economic measure has been used successfully in previous studies to measure socioeconomic inequalities and is especially recommended for LMICs
13
. Two categories of variables, including place of resistance (such as home ownership and floor area) and household assets (such as private car, motorcycle, computer, internet use, kitchen, telephone, and central heating machine) used to construct the wealth index. The constructed wealth index was divided into 5 quintiles (poorest, poor, middle, rich, and richest) for using in the subsequent analysis.
Healthcare utilization measure
As a proxy for health care utilization, we used utilization of outpatient health care services measured in the first section of healthcare utilization questionnaire. Several questions from this survey were used to measure need for healthcare services and utilization of them. In this research, one question from household questionnaire was used as outpatient services’ need (have you needed any outpatient care within two weeks?). On the other hand, one question from healthcare utilization questionnaire was used as utilization of outpatient services (have you used any outpatient services within the last two weeks?)
Inequality analysis
The concentration index and concentrating curve alongside odds ratio (richest to poorest quintiles odds ratio of healthcare utilization) was used to analyze potential inequality in outpatient healthcare utilization in Iran. Provincial wealth index, concentration index, and odds ratio were also calculated for provinces of Iran. Finally, GIS analysis was used to show provincial concentration index on Iran’s map.
Concentration curve
The concentration curve was introduced to show how loss or gain in an outcome (healthcare utilization here) is distributed between different economic groups. In this curve, the cumulative percentage of subjects (individuals, households or jurisdictions) is ranked according to their economic status. If the outcome of interest unequally distributed among poor economic groups, the concentration curve will be above the equality line and vice versa. If the outcome equally distributed among studied units, the concentration curve will coincide with line of equality
14
.
Concentration index
Concentration index is the most famous measure that has been used in the health inequality literature,
15
. This measure could be calculated from the enclosed space between the concentration curve and line of equality. If the concentration curve placed above the line of equality, the index will be negative and vice versa. Equation 1, which is based on Kakvani formula, shows concentration index mathematically.
In this equation, Yi shows the outcome (health care utilization) of the ith studied units, μ indicates its average, and Ri represents the fractional rank of the ith participants in the economic status distribution. Concentration index varied between -1 and +1, where -1 implies that the studied outcome is entirely concentrated among the poor and vice versa.
The STATA software version 12 was used for statistical analysis. The conindex DO file of STATA software was used to calculate concentration index in aggregate level for Iran and its provinces. This DO file has possibility to compare inequality between levels of modifying factor
16
. GIS analysis was conducted by tmap package of R software.
Results
Out of 78378 surveyed subjects, 18984 had reported the need for outpatient healthcare services in the last two weeks. Needs of 10222 (66.4%) subjects, aged 15 yr or older have been met. Majority of studied units were female (59.57%) and lived in urban areas (66.16%) (Table 1).
Table 1.
Summary statistics for healthcare utilization (outpatient healthcare services) based on data from the Iranian healthcare utilization survey 2015
|
Variables
|
Number
|
Percent
|
| Healthcare utilization |
|
|
| Yes |
10222 |
69.1 |
| No |
4563 |
30.9 |
| Sex |
|
|
| Male |
5978 |
40.4 |
| Female |
8807 |
59.6 |
| Area of residence |
|
|
| Rural |
5003 |
33.8 |
| Urban |
9782 |
66.2 |
| Wealth index |
|
|
| Poorest |
2,965 |
20.3 |
| Poor |
3,057 |
20.6 |
| Middle |
2,977 |
20.1 |
| Rich |
2,836 |
19.2 |
| Richest |
2,956 |
2.0 |
The rates of outpatient utilization of healthcare services are shown across the wealth quintiles. Subjects with higher economic status had higher rate of outpatient healthcare utilization. Moreover rates of healthcare utilization regarding to sex and residence area of subjects were studied. The rate of healthcare utilization in males, females, and rural as well as urban areas was higher in the rich quintiles (Table 2).
Table 2.
Estimated concentration index, odds ratio and their standard error of health care utilization with regard to the subgroup analysis in Iran, 2015
|
Variables
|
Wealth quintiles
|
Richest to poorest Quintiles
|
Concentration
index
|
Concentration
indices
|
|
Poorest
|
Poor
|
Middle
|
Rich
|
Richest
|
Odds Ratio (95% CI)
|
p value
|
Odds Ratio (95% CI)
|
p value
|
Diff.
|
P value
|
Healthcare utilization
(SD)
|
0.62
(0.48)
|
0.66
(0.47)
|
0.68
(0.46)
|
0.70
(0.45)
|
0.74
(0.43)
|
1.14
(1.11, 1.17)
|
0.001 |
0.09
(0.77, 0.11)
|
0.001 |
|
|
Healthcare
utilization-
sex (SD)
|
Male |
0.58
(0.49)
|
0.63
(0.48)
|
0.661
(0.47)
|
0.65
(0.48)
|
0.74
(0.43)
|
1.17
(1.12, 1.22)
|
0.001 |
0.11
(0.08, 0.14)
|
0.001 |
-0.032 |
0.072 |
| Female |
0.64
(0.48)
|
0.68
(0.46)
|
0.70
(0.45)
|
0.72
(0.44)
|
0.74
(0.43)
|
1.12
(1.08, 1.16)
|
0.001 |
0.08
(0.06, 0.10)
|
0.001 |
|
|
Healthcare
utilization-
living area
(SD)
|
Urban |
0.64
(0.43)
|
0.68
(0.45)
|
0.70
(0.45)
|
0.70
(0.45)
|
0.75
(0.43)
|
1.12
(1.08, 1.16)
|
0.001 |
0.08
(0.06, 0.10)
|
0.001 |
-0.039 |
0.039 |
|
|
Rural |
0.60
(0.48)
|
0.63
(0.48)
|
0.65
(0.47)
|
0.66
(0.47)
|
0.67
(0.48)
|
1.07
(1.02, 1.13)
|
0.003 |
0.04
(0.01, 0.07)
|
0.006 |
|
|
The concentration index and odds ratio for outpatient healthcare utilization and regarding sex and living area are also summarized in Table 2. The concentration index for healthcare utilization was obtained as 0.094 (95%CI: 0.77, 0.11). This statistically significant concentration index implies that outpatient healthcare utilization concentrated among subjects with higher economic status. In addition the odds ratio of outpatient utilization indicated that subjects with higher economic status have more chance to use these healthcare services. The corresponding concentration curve of healthcare utilization is also depicted in Figure 1.
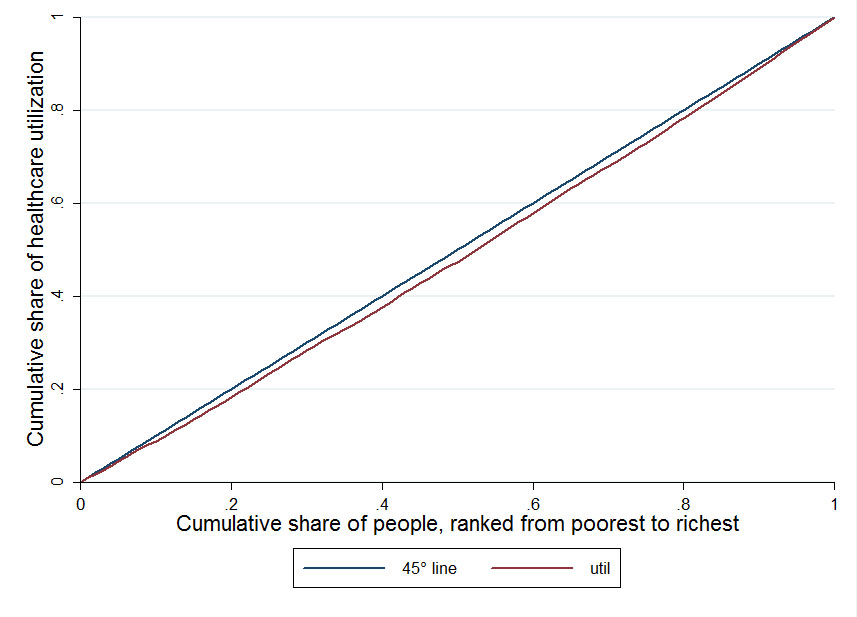
Figure 1.
Concentration curve for healthcare utilization in Iran, 2015
.
Concentration curve for healthcare utilization in Iran, 2015
The concentration index regarding male, female, and urban as well as rural area was calculated as 0.115, 0.083, 0.082 and 0.042, respectively. All of these concentration indices were statistically significant. According to showed indices, the size of these pro-rich inequalities in outpatient healthcare utilization was higher in males and the people living in the urban areas. The difference between concentration indices also reported in Table 2. Only differences between rural and urban concentration indices were statistically significant. The result of odds ratio for sex and area of residence also showed that the subjects with higher wealth quintiles have larger chance to use outpatient health care services.
Table 3 shows the outpatient healthcare utilization rate, its standard error for different economic quintiles, and measures of economic inequality in health care utilization for each province. The relative difference in outpatient healthcare utilization rates between highest and lowest quintiles was statistically significant in provinces such as Markazi, Mazandaran, Kermanshah, Khozestan, Lorestan, Kordestan, Razavi Khorasan, Ilam, Zanjan, Chaharmahal and Bakhtiari, Golestan, Ardabil, and Qazvin. Among the provinces with a statistically significant odds ratio, the ratio varied from 0.84 in Chaharmahal and Bakhtiari to 1.73 in Semnan. Based on the concentration index, except for Markazi and Kordestan, inequality in outpatient health care utilization was also statistically significant in above mentioned provinces and Hamadan. This measure in these provinces ranged from 0.348 in Kohgiloye and Boyerahmad to -0.138 in Chaharmahal and Bakhtiari. The corresponding provincial concentration index of healthcare utilization was illustrated in the map of Iran in the Figure 2.
Table 3.
Estimated healthcare utilization in economic quintiles, odds ratio and concentration index by province, Iran 2015
|
Province
|
Health care utilization (SD), wealth quintiles
|
Richest to poorest
quintiles odds ratio
|
Concentration index
|
|
Poorest
|
Poor
|
Middle
|
Rich
|
Richest
|
Value
(95%CI)
|
P value
|
Value
(95%CI)
|
P value
|
| Markazi |
0.77
(0.42)
|
0.80
(0.38)
|
0.82
(0.38)
|
0.78
(0.41)
|
0.93
(0.40)
|
1.26
(1.01, 1.57)
|
0.034 |
0.08
(-0.01, 0.18)
|
0.072 |
| Gilan |
0.72
(0.45)
|
0.71
(0.45)
|
0.79
(0.40)
|
0.73
(0.44)
|
0.81
(0.39)
|
1.12
(0.76, 1.04)
|
0.129 |
0.07
(-0.02, 0.17)
|
0.112 |
| Mazandaran |
0.50
(0.50)
|
0.50
(0.50)
|
0.52
(0.50)
|
0.51
(0.50)
|
0.64
(0.48)
|
1.16
(1.03,1.30)
|
0.009 |
0.09
(0.00, 0.18)
|
0.031 |
| East Azarbaijan |
0.69
(0.46)
|
0.62
(0.48)
|
0.75
(0.43)
|
0.60
(0.49)
|
0.76
(0.42)
|
1.10
(0.97, 1.25)
|
0.132 |
0.08
(-0.00, 0.17)
|
0.055 |
| West Azarbaijan |
0.52
(0.50)
|
0.57
(0.49)
|
0.67
(0.47)
|
0. 75
(0.43)
|
0.79
(0.40)
|
1.03
(0.91, 1.64)
|
0.612 |
0.02
(-0.07, 0.11)
|
0.656 |
| Kermanshah |
0.58
(0.49)
|
0.69
(0.46)
|
0.62
(0.48)
|
0.60
(0.49)
|
0.64
(0.48)
|
1.41
(0.91, 1.64)
|
0.000 |
0.22
(0.131, 0.31)
|
0.000 |
| Khozestan |
0.70
(0.45)
|
0.64
(0.47)
|
0.61
(0.48)
|
0.67
(0.47)
|
0.57
(0.49)
|
1.11
(1.21,1.64)
|
0.021 |
0.09
(0.02, 0.16)
|
0.009 |
| Fars |
0.77
(0.41)
|
0.77
(0.41)
|
0.74
(0.44)
|
0.78
(0.41)
|
0.71
(0.45)
|
0.94
(0.83, 1.06)
|
0.357 |
-0.04
(-0.12, 0.03)
|
0.244 |
| Kerman |
0.61
(0.48)
|
0.67
(0.46)
|
0.57
(0.49)
|
0.50
(0.50)
|
0.55
(0.49)
|
0.90
(0.93,1.18)
|
0.044 |
-0.07
(-0.15, 0.01)
|
0.080 |
| Razavi Khorasan |
0.61
(0.48)
|
0.70
(0.45)
|
0.66
(0.47)
|
0.73
(0.44)
|
0.75
(0.42)
|
1.15
(1.01,1.30)
|
0.031 |
0.08
(0.00, 0.17)
|
0.029 |
| Esfahan |
0.75
(0.43)
|
0.73
(0.44)
|
0.67
(0.47)
|
0.68
(0.46)
|
0.80
(0.39)
|
1.05
(0.93,1.18)
|
0.379 |
0.03
(-0.04, 0.10)
|
0.356 |
| Sistan and Balochestan |
0.54
(0.49)
|
0.61
(0.49)
|
0.84
(0.36)
|
0.64
(0.48)
|
0.56
(0.50)
|
1.18
(1.02,1.38)
|
0.026 |
0.152
(0.04, 0.260)
|
0.052 |
| Kordestan |
0.73
(0.44)
|
0.66
(0.47)
|
0.71
(0.45)
|
0.92
(0.27)
|
0.84
(0.37)
|
1.32
(1.04,1.68)
|
0.019 |
0.098
(-0.029, 0.22)
|
0.124 |
| Hamadan |
0.57
(0.49)
|
0.56
(0.49)
|
0.70
(0.45)
|
0.70
(0.46)
|
0.63
(0.48)
|
1.15
(0.97,1.36)
|
0.102 |
0.11
(0.00, 0.22)
|
0.042 |
| Chaharmahal and Bakhtiari |
0.77
(0.41)
|
0.80
(0.40)
|
0.63
(0.48)
|
0.63
(0.48)
|
0.67
(0.47)
|
0.84
(1.03,1.4)
|
0.024 |
-0.13
(-0.24, 0.03)
|
0.008 |
| Lorestan |
0.59
(0.49)
|
0.63
(0.48)
|
0.70
(0.45)
|
0.69
(0.46)
|
0.79
(0.41)
|
1.23
(1.07, 1.40)
|
0.002 |
0.16
(0.07, 0.26)
|
0.000 |
| Ilam |
0.36
(0.48)
|
0.35
(0.47)
|
0.51
(0.50)
|
0.46
(0.50)
|
0.67
(0.47)
|
1.39
(1.14,1.71)
|
0.001 |
0.17
(0.04, 0.30)
|
0.007 |
| Kohgiloye and boyerahmad |
0.44
(0.49)
|
0.60
(0.49)
|
0.71
(0.45)
|
0.70
(0.45)
|
0.80
(0.39)
|
1.47
(1.26, 1.73)
|
0.000 |
0.348
(0.23, 0.45)
|
0.000 |
| Boshehr |
0.86
(0.34)
|
0.89
(0.30)
|
0.82
(0.38)
|
0.78
(0.41)
|
0.80
(0.39)
|
0.86
(0.69, 1.06)
|
0.172 |
-0.073
(-0.17, 0.02)
|
0.132 |
| Zanjan |
0.69
(0.46)
|
0.79
(.041)
|
0.88
(0.31)
|
0.92
(0.27)
|
0.96
(0.17)
|
1.82
(1.42,2.33)
|
0.000 |
0.24
(0.15, 0.33)
|
0.000 |
| Semnan |
0.42
(0.50)
|
0.90
(0.29)
|
0.88
(0.32)
|
0.82
(0.38)
|
0.91
(0.28)
|
1.73
(1.16,2.56)
|
0.006 |
0.22
(0.09, 0.35)
|
0.000 |
| Yazd |
0.74
(0.44)
|
0.74
(0.44)
|
0.90
(0.29)
|
0.88
(0.31)
|
0.82
(0.38)
|
1.17
(0.89, 1.55)
|
0.250 |
0.06
(-0.04, 0.16)
|
0.230 |
| Hormozgan |
0.70
(0.45)
|
0.62
(0.48)
|
0.63
(0.48)
|
0.56
(0.49)
|
0.59
(0.49)
|
0.87
(0.76,1.00)
|
0.052 |
-0.12
(-0.23, -0.01)
|
0.026 |
| Tehran |
0.82
(0.38)
|
0.73
(0.44)
|
0.86
(0.34)
|
0.82
(0.38)
|
0.82
(0.37)
|
1.06
(0.91, 1.25)
|
0.399 |
0.04
(-0.02, 0.11)
|
0.219 |
| Ardabil |
0.51
(0.50)
|
0.71
(0.46)
|
0.73
(0.44)
|
0.69
(0.46)
|
0.78
(0.41)
|
1.26
(1.06, 1.49)
|
0.006 |
0.14
(0.04, 0.23)
|
0.004 |
| Qom |
0.54
(0.50)
|
0.71
(0.45)
|
0.62
(0.48)
|
0.58
(0.49)
|
0.63
(0.48)
|
1.01
(0.79, 1.13)
|
0.862 |
0.04
(-0.08, 0.16)
|
0.498 |
| Qazvin |
0.39
(0.49)
|
0.51
(0.50)
|
0.65
(0.47)
|
0.58
(0.49)
|
0.69
(0.46)
|
1.29
(1.12, 1.49)
|
0.000 |
0.168
(0.06, 0.26)
|
0.008 |
| Golestan |
0.46
(0.50)
|
0.50
(0.50)
|
0.56
(0.49)
|
0.49
(0.50)
|
0.59
(0.49)
|
1.11
(1.00, 1.24)
|
0.047 |
0.088
(0.00, 0.17)
|
0.045 |
| North Khorasan |
0.74
(0.44)
|
0.83
(0.37)
|
0.90
(0.30)
|
0.78
(0.41)
|
0.81
(0.39)
|
1.05
(0.78, 1.41)
|
0.719 |
0.032
(-0.09, 0.16)
|
0.615 |
| South Khorasan |
0.57
(0.49)
|
0.75
(0.43)
|
0.60
(0.49)
|
0.69
(0.46)
|
0.70
(0.46)
|
1.07
(0.90,1.28)
|
0.398 |
0.062
(-0.06, 0.18)
|
0.331 |
| Alborz |
0.72
(0.45)
|
0.76
(0.42)
|
0.67
(0.47)
|
0.80
(0.39)
|
0.75
(0.43)
|
1.05
(0.89, 1.25)
|
0.519 |
0.028
(-0.06, 0.12)
|
0.561 |
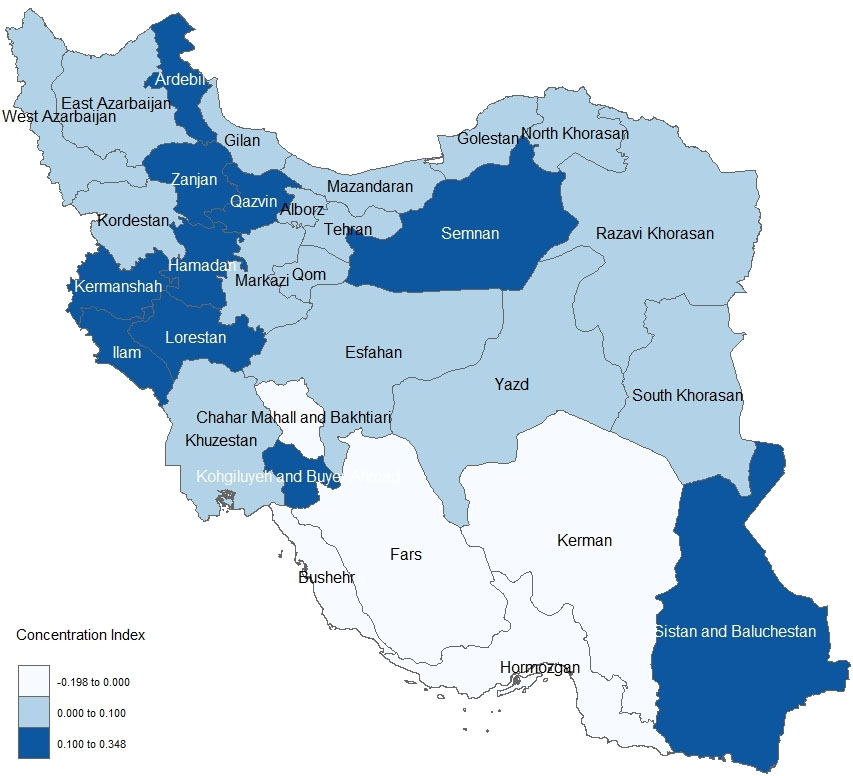
Figure 2.
Provincial concentration index of healthcare utilization
.
Provincial concentration index of healthcare utilization
Discussion
Based on our knowledge, this research is the first to investigate inequality in outpatient health care utilization simultaneously in Iran and across its provinces. There is a direct relationship between utilization of outpatient services and economic status in Iran and within some of its provinces.
In the aggregate level, utilization of outpatient services is concentrated among the rich subjects. According to another measure of inequality, people with higher economic status have greater chance to benefit from these services. This finding is in line with previous studies that conducted in Iran
3,4
and other nations
17-19
. Compared with other studies in Iran,
4
, it seems that after HTP
11
, the outpatient healthcare utilization inequality in Iran still concentrated among the rich households. This indicates that this policy has no desirable effect on health care inequality. This study is not in line with former study
20
that conducted in the west of Iran that showed the inequality in public healthcare utilization was pro-poor in Kermanshah.
In this research, males and females with higher economic status had greater chance to use required health care services. The results of concentration index also confirmed this finding. This is in accordance with former researches that conducted in Iran,
4
. Male subjects have greater concentration index. This seems logical; females have higher healthcare needs
21
and may have higher rate of healthcare utilization. There are no significant differences between concentration indices of male and females. This highlighted that Iran has no gender disparity in the utilization of outpatient health care services. Place of residence is another factor that may have affects healthcare inequalities
22
. In this study, utilization of outpatient services was concentrated among rural and urban rich quintiles. Urban residents have greater concentration index that was statistically significant. This seems logical; urban households in Iran have higher income inequality and this may worsen health care inequalities such as inequality in utilization of required healthcare services.
Healthcare inequality could be understood through spatial analysis. The findings of this research showed that outpatient healthcare utilization inequality was spatially distributed in Iran. Subjects that ranked in higher economic status in provinces such as Mazandaran, Kermanshah, Razavi Khorasan, Khozestan, Lorestan, Ilam, Semnan, Zanjan, Kohgiloye and Boyerahmad, Kordestan, Ardabil, and Qazvin, had greatest odds to utilize from required health care services. The results of concentration index also confirmed that utilization of outpatient services were concentrated among rich residents of these provinces. This means that in the local level, HTP could not eliminate pro-rich inequality of outpatient healthcare services. National and subnational policy maker must pay attention to this issue and not only provide and finance more human and physical health resources in these provinces but also increase regional policy making to boost health equity. On the other hand, both inequality measures showed that outpatient healthcare inequality in Chaharmahal and Bakhtiari, and Hormozgan was pro-poor. This may be due to immigration of people with higher socioeconomic status to benefit from healthcare services in neighboring provinces.
The findings of this study revealed that after of the HTP Iranians still suffer from pro-rich inequality of outpatient services. This experience highlighted that only spending money could not guarantee health sector reforms. Different social, political and economic factors may have different impacts on effectiveness of UHC programs
23
. Hence, it is strongly recommended that intersectoral action
24
must be increased in Iran to correct HTP in future.
This study has some limitation that must be acknowledged. It is clear that by using direct economic variables such as income or consumption level of households, inequality analysis could be able to show potential inequalities more effectively. However, in this research the asset index approach, which widely used in previous studies from developing nations, was used to rank studied households. Therefore, it is recommended that future survey in Iran include both monetary and asset index questions. Considering that this study has cross-sectional design, interpretations should be made with caution.
Conclusion
Economic inequality in healthcare utilization was pro-rich in Iran as a whole and in some of its provinces. On the other hand, two provinces simultaneously had pro-rich healthcare inequality. It seems that the healthcare inequality has spatial pattern in Iran. Examining why this inequality favors the better-off in these provinces deserves special attention. Intersectoral cooperation also recommended correcting HTP in future.
Acknowledgements
This study was part of a Ph.D. thesis supported by the Iran University of Medical Sciences (grant no. IUMS/SHMIS_20169321504002). The authors hereby would like to thank Mr. Muhammad Shamsaldini and Dr. Nahid Aghaei for their valuable guidance. The authors also thank the Iran National Institute of Health Research (NIHR) for their support and for free access to the original data of UHS.
Conflict of interest statement
None of the authors has any financial or other interests that might influence the conduct of the study or accurate reporting of the results.
Funding
No commercial or sponsor support was used for current study.
Highlights
-
One of important goals of any health system is to reduce healthcare inequalities in its jurisdiction.
-
After Healthcare Transformation Plan, Iranians still suffer from pro-rich outpatient healthcare utilization inequality.
-
It seems that the healthcare inequality has spatial pattern in Iran.
-
Intersectoral action also recommended correcting HTP in future.
References
-
World Health Organization. The world health report 2000: health systems: improving performance: World Health Organization; 2000.
- Rezapour A, Ebadifard Azar F, Azami Aghdash S, Tanoomand A, Hosseini Shokouh SM, Yousefzadeh N. Measuring equity in household's health care payments (Tehran-Iran 2013): technical points for health policy decision makers. Med J Islam Repub Iran 2015; 29(1):246. [ Google Scholar]
- Mohammadbeigi A, Hassanzadeh J, Eshrati B, Rezaianzadeh A. Socioeconomic inequity in health care utilization, Iran. J Epidemiol Glob Health 2013; 3(3):139-46. [ Google Scholar]
- Hajizadeh M, Connelly LB, Butler James RG, Khosravi A. Unmet need and met unneed in health care utilisation in Iran. Int J Soc Econ 2012; 39(6):400-22. [ Google Scholar]
- Mackenbach JP, Meerding WJ, Kunst AE. Economic costs of health inequalities in the European Union. J Epidemiol Community Health 2011; 65(5):412-9. [ Google Scholar]
- Korda RJ, Butler JR, Clements MS, Kunitz SJ. Differential impacts of health care in Australia: trend analysis of socioeconomic inequalities in avoidable mortality. Int J Epidemiol 2007; 36(1):157-65. [ Google Scholar]
- Boerma T, Eozenou P, Evans D, Evans T, Kieny MP, Wagstaff A. Monitoring progress towards universal health coverage at country and global levels. PLoS Med 2014; 11(9):e1001731. [ Google Scholar]
- Rezaei S, Fallah R, Kazemi Karyani A, Daroudi R, Zandiyan H, Hajizadeh M. Determinants of healthcare expenditures in Iran: evidence from a time series analysis. Med J Islam Repub Iran 2016; 30(1):313. [ Google Scholar]
- Vosoogh Moghaddam A, Damari B, Alikhani S, Salarianzedeh M, Rostamigooran N, Delavari A. Health in the 5th 5-years Development Plan of Iran: Main Challenges, General Policies and Strategies. Iran J Public Health 2013; 42:42-9. [ Google Scholar]
- Khayatzadeh-Mahani A, Takian A. Family physician program in Iran: considerations for adapting the policy in urban settings. Arch Iran Med 2014; 17(1):776-8. [ Google Scholar]
- Mahdavi M, Parsaeian M, Jaafaripooyan E, Ghaffari S. Recent Iranian Health System Reform: An Operational Perspective to Improve Health Services Quality. Int J Health Policy Manag 2017; 7(1):70-4. [ Google Scholar]
-
Ali Akbari Saba R, Safakish M, Safakish Z, Khabiri Nemati R, Zahedian A, Khosravi A, et al. Utilization of Health Services (UHS) 2015. Tehran: Ministry of Health and Medical Education 2016. [in Persian].
- Vyas S, Kumaranayake L. Constructing socio-economic status indices: how to use principal components analysis. Health Policy Plan 2006; 21(6):459-68. [ Google Scholar]
- Wagstaff A, Paci P, van Doorslaer E. On the measurement of inequalities in health. Soc Sci Med 1991; 33(5):545-57. [ Google Scholar]
- Ramezani Doroh V, Vahedi S, Arefnezhad M, Kavosi Z, Mohammadbeigi A. Decomposition of Health Inequality Determinants in Shiraz, South-west Iran. J Res Health Sci 2015; 15(3):152-8. [ Google Scholar]
- O'Donnell O, O'Neill S, Van Ourti T, Walsh B. conindex: Estimation of concentration indices. Stata J 2016; 16(1):112-38. [ Google Scholar]
- van Doorslaer E, Wagstaff A, van der Burg H, Christiansen T, De Graeve D, Duchesne I. Equity in the delivery of health care in Europe and the US. J Health Econ 2000; 19(5):553-83. [ Google Scholar]
- van Doorslaer E, Koolman X, Jones AM. Explaining income-related inequalities in doctor utilisation in Europe. Health Econ 2004; 13(7):629-47. [ Google Scholar]
- Dorjdagva J, Batbaatar E, Dorjsuren B, Kauhanen J. Income-related inequalities in health care utilization in Mongolia, 2007/2008-2012. Int J Equity Health 2015; 14:57. [ Google Scholar]
- Rezaeian S, Hajizadeh M, Rezaei S, Ahmadi S, Kazemi Karyani A, Salimi Y. Measuring and Explaining Socioeconomic Inequalities in Public Healthcare Utilization in Western Iran: Evidence from a Cross-sectional Survey. J Res Health Sci 2018; 18(2):e00415. [ Google Scholar]
- Doyal L. Sex, gender, and health: the need for a new approach. BMJ 2001; 323:1061-3. [ Google Scholar]
- Lahana E, Pappa E, Niakas D. Do place of residence and ethnicity affect health services utilization? evidence from greece. Int J Equity Health 2011; 10(1):16. [ Google Scholar]
- Borgonovi E, Compagni A. Sustaining Universal Health Coverage: The Interaction of Social, Political, and Economic Sustainability. Value Health 2013; 16(1 Suppl):S34-8. [ Google Scholar]
- Ndumbe-Eyoh S, Moffatt H. Intersectoral action for health equity: a rapid systematic review. BMC Public Health 2013; 13(1):1056. [ Google Scholar]