J Res Health Sci. 25(1):e00637.
doi: 10.34172/jrhs.2025.172
Original Article
Multivariate Joint Analysis of Blood Pressure Measurements and Time to Remission: A Case Study of Hypertensive Patients Receiving Treatment at Jimma University Medical Center
Jiregna Abebe Akasa Data curation, Formal analysis, Investigation, Methodology, Project administration, Resources, Software, Supervision, Validation, Visualization, Writing – original draft, Writing – review & editing, 1, * 
Sisay Wondaya Conceptualization, Methodology, Validation, Visualization, Writing – original draft, Writing – review & editing, 2
Shiferaw Befikadu Methodology, Writing – original draft, Writing – review & editing, 2
Author information:
1Department of Statistics, College of Natural and Computational Sciences, Dambi Dollo University, Dambi Dollo, Ethiopia
2Department of Statistics, College of Natural Sciences, Jimma University, Jimma, Ethiopia
Abstract
Background: Hypertension (HTN) elevates blood pressure (BP) in the arteries. It is defined as systolic BP (SBP)>140 mm Hg and/or diastolic BP (DBP)>90 mm Hg. This study aimed to identify determinant risk factors of longitudinal change of SBP and DBP with time to first remission of hypertensive patients.
Study Design: A retrospective cohort study.
Methods: A descriptive and inferential analysis was employed to explore the determinant risk factors, and a multivariate joint model was applied to test the significant association of the possible risk factors.
Results: Of all 369 patients, 235 (63.7%) had first remission with a median survival time of five months. The patients demonstrated shorter first remission time when they had no history of comorbidity, resided in urban areas, took a combination of drugs, and were younger. Similarly, residence, age, treatment, history of diabetes mellitus (DM), history of stroke, and observation time were determinant risk factors of SBP. On the other hand, age, treatment, history of DM, chronic kidney diseases, and observation time were identified as determinant risk factors of DBP. The result revealed a strong positive association between changes in SBP and DBP (P=0.9923). In addition, a significant association was observed between the value of SBP and time to first remission (γ_1=-0.0693, HR=0.993).
Conclusion: Having good follow-ups, receiving control of comorbidity, and taking a combination of drugs show several opportunities for decreasing BP. Consequently, this compels patients to experience the first remission early.
Keywords: Remission, Systolic and diastolic blood pressure, Longitudinal change, Ethiopia
Copyright and License Information
© 2025 The Author(s); Published by Hamadan University of Medical Sciences.
This is an open-access article distributed under the terms of the Creative Commons Attribution License (
https://creativecommons.org/licenses/by/4.0/), which permits unrestricted use, distribution, and reproduction in any medium, provided the original work is properly cited.
Please cite this article as follows: Akasa JA, Wondaya S, Befikadu S. Multivariate joint analysis of blood pressure measurements and time to remission: a case study of hypertensive patients receiving treatment at Jimma university medical center. J Res Health Sci. 2025; 25(1):e00637. doi:10.34172/jrhs.2025.172
Background
Hypertension (HTN) is a chronic medical condition in which blood pressure (BP) is elevated in arteries.1,2 In BP measurements, HTN is defined as systolic BP (SBP) equal to or above 140 mm Hg and/or diastolic BP (DBP) equal to or above 90 mm Hg.3 Normal levels of both SBP and DBP are particularly important for the efficient function of vital organs.4
HTN is a worldwide public health challenge for both economically developed and developing countries as a leading flexible risk factor for cardiovascular diseases (CVDs) and death. It is becoming more common all over the world and affected 972 million individuals in 2000, with a prevalence rate of 26.4%. In 2025, the number of people affected by HTN is expected to rise to 1.54 billion, with a prevalence rate of 29.2%.5 In addition, it is more common in low- and middle-income countries than high-income countries, such as South and East Asia and Sub-Saharan Africa, where 23% of the 1.13 billion adults with high BP lived in South Asia (199 million in India) and another 21% (235 million) lived in East Asia, and there are also more people affected because those countries have more people than high-income countries.6
In Africa, HTN is the most common cause of CVD.7 The studies conducted in Ethiopia, Kenya, Nigeria, and Tanzania revealed that the prevalence of HTN in Sub-Saharan African countries ranged from 10.1% in Southern Ethiopia to 23.7% in Tanzania.8-11 The prevalence of uncontrolled HTN was high in Ethiopia.12 According to data from Ethiopia’s Federal Ministry of Health, HTN was the seventh greatest cause of mortality in 2015, accounting for 1.8% of all deaths.13 Based on the evidence from the national non-communicable disease survey of Ethiopia, there was a 15% overall prevalence of HTN.14 In some places of southern Ethiopia, the prevalence of HTN ranged from 22% to 35%.15,16
The BP is one of the repeatedly measured statuses over time for hypertensive patient diagnosis. This type of study allows joint modeling of multivariate longitudinal profiles, which is necessary for association structure and evolution of associations, and improves the results of a discriminant analysis of repeatedly measured outcomes.17
Longitudinal and survival data are frequently found combined and are crucial indicators of health in many medical investigations. Repeated measurements of HTN patients taken at various times provide longitudinal observations such as SBP and DBP. The time it takes for each patient to experience the event throughout a certain study period is time-to-event data. Therefore, to simultaneously incorporate all available data and make the best prediction, a joint model (JM) approach is feasible.18
Many well-established approaches exist, including the linear mixed-effects model (LMM) for longitudinal data and parametric or semi-parametric models for survival data separately. The JM, on the other hand, simultaneously estimates both the longitudinal and time-to-event components, making it better suited for evaluating such data because it calculates the relative risk of the time-to-event result based on the longitudinal outcome.19,20 When compared to longitudinal and survival models independently, JM allows for significant improvements in estimation accuracy and provides effective and efficient predictions, making accurate uncovering insights.21
Many earlier strategies for combining longitudinal and time-to-event outcomes only allowed for one longitudinal outcome and one event time. However, JM of multiple longitudinal outcomes and a time-to-event, which is called multivariate JM (MVJM), are more beneficial in parameter estimation and result in accurate model predictions.22
Most studies in Ethiopia are focused on longitudinal changes in SBP and DBP over time and separate survival analyses to assess time for good control of HTN.13,23,24 However, patients are repeatedly measuring their SBP and DBP, which are potentially predictive for the time-to-event. Concerning the interdependency of these BP outcomes (SBP and DBP) with the time to event, it is necessary to evaluate factors that affect the rate of change in these outcomes jointly.4
As a result, in this study, an MVJM was used, which includes the influence of variables on the time to first remission in the presence of change in BP (SBP and DBP) and an association between the time to remission and BP measurement. This study sought to identify determinant risk factors of longitudinal changes in SBP and DBP with time to first remission of hypertensive patients jointly and to investigate the associations of the evolution of BP measurements over time.
Methods
Study area
This study was conducted at Jimma University Medical Center (JUMC), which is located in Oromia Regional State, 352 kilometers southwest of Addis Ababa, in Jimma town.25
Study design and data collection
A retrospective study design was employed, and the data were collected from hypertensive patients undergoing treatment at JUMC. The required data were extracted from the medical chart of patients receiving follow-ups (at least three visits) from September 1, 2018, to August 30, 2021.
Populations of the study
The study participants included all patients in JUMC and those who had recorded information on HTN follow-ups. A total of 369 patients were considered in this study based on the inclusion criteria.
Variables of the study
The response variables were the patient’s BP measurements (SBP and DBP) in mm Hg and the time to first remission that it takes to have controlled BP (in months). The day that the patients with HTN were first admitted to the hospital served as the starting point. The end is when the hypertensive patients’ status is back to the normal range of BP or remission (SBP < 140 mm Hg and DBP < 90 mm Hg, respectively) while receiving treatment at the hospital. The observation time, gender, residence, baseline age, regimen type, blood urea nitrogen (BUN), treatment, comorbidity, and serum creatinine level of the hypertensive patients were all the explanatory variables considered in this investigation.
In this study, if the patients did not experience the event of interest (first remission) up to the end of the study, for the sake of loss to follow up or transfer to another hospital or death due to different causes or even death due to HTN or termination of the study, they all were considered censored.
Operational definitions
Remission is defined as if the patients’ BP remains within the normotensive range (SBP < 140 mm Hg and/or BP < 90 mm Hg, respectively) while receiving treatment at the hospital.
Event is defined as the first remission of HTN during the follow-up time from September 1, 2018, to August 30, 2021.
Time to Remission is the time from the first day of admission for HTN treatment to the first remission.
Inclusion and exclusion criteria
The inclusion criteria were all hypertensive outpatients, whose age was 18 and above years, regardless of their treatment category during the study period in the hospital, and those outpatients having more than two visit times were included in this study.
However, hypertensive outpatients admitted with only less than three visits and those under the age of 18 were not included in this study. Additionally, patients with isolated systolic HTN defined as elevated SBP ( ≥ 140 mm Hg) and low DBP ( < 90 mm Hg), isolated diastolic HTN (DBP ≥ 90 mm Hg and SBP < 140 mm Hg), and incomplete recording of baseline were not included in this study.
Statistical methods
In this study, the data were explored by using a Kaplan-Meier curve plot, an individual plot, and a mean profile plot. Then, the time to first remission of HTN and longitudinal measures of SBP and DBP of the patients were taken during the follow-up and separately and jointly analyzed to identify the determinant risk factors. The multivariate joint longitudinal-survival model was analyzed to assess the influence of longitudinal changes in SBP and DBP over time on the first remission of HTN.
An MVJM is comprised of a multivariate longitudinal data model and a time-to-event data model. Now, let us show the notation for bivariate longitudinal and time-to-event data.
Let
denotes the jth observed value of the kth longitudinal outcome for subject i, measured at time tijk for i = 1,…,N; k = 1,...,K, and j = 1,..., nik. A bivariate linear mixed model (MLMM) is a common approach where measurements for different outcomes can be recorded at different times between patients and outcomes, and it is given by:
(1)
Where
and
are row vectors of the covariate for subject i, associated with fixed and random effects, respectively, which can vary by outcome; βk is a vector of fixed effect parameters for the kth outcome, and bik is a vector of subject-specific random effects for the outcome. The vector of subject-specific random effects for all K outcomes is denoted by
.
The εik represents a corresponding measurement error term such that εik ~N(0,Σ). In this study, the variance-covariance matrix of random effects ψ implies the correlations among different longitudinal processes as well as the within-subject correlation for each longitudinal measurement (SBP and DBP). The measurement errors of distinct longitudinal outcomes are assumed to be independent of one another, as well as the random effects bi.26
For survival outcomes, we consider the Cox proportional hazard model,21 which is given as:
Where Xi is the vector of baseline covariates with the corresponding parameter estimates, and αi; h0(t) denotes the baseline hazard function. In addition, γi(t) is the latent process that captures the association structure between the longitudinal measurement and event processes.
Model selection and diagnostics
The Akaike information criterion (AIC) was used to select the appropriate model, which is a lower criterion value and suggests a better fit. The AIC is given by:
Where k is the number of parameters, and n is the number of observations, and
is the joint maximized value of the likelihood function of the model, in which
is the parameter value that maximizes the likelihood function. The adequacy of the model, subject-specific residuals, and the marginal residuals were used to assess the assumptions of the standard LMM. The marginal residuals predict the marginal errors and can be utilized to investigate the misspecification of the mean structure and to validate the assumptions for the within-subject covariance structure. By the way, the unstructured covariance structure was selected for LMM.21 For survival models, the hazard function of one individual is proportional to that of the other individual (i.e., the hazard ratio is constant over time). The Schottenfeld residuals27 and global test of the proportional assumption were employed for this purpose.28 The convergence of Monte-Carlo expectation maximization was checked for the adequacy of MVJM; by default, it is checked by the trace plots. The joineRML packages of R-software, which is developed for MVJMs under a classical approach, were used for analysis.26
Results
This study included a sample of 369 hypertensive patients. The data were explored by using graphical and tabular presentations. Of all patients, 201 (54.5%) were male, and 190 (51.5%) were from urban areas. In general, 235 (63.7%) hypertensive patients treated at the JUMC attained the event of interest (the first remission). Based on the history of other comorbidity diseases, among the hypertensive patients, 51 (13.8%), 68 (18.4%), 241 (65.3%), and 65 (17.6%) had a history of diabetes mellitus (DM), CVD, stroke, and chronic kidney disease (CKD), respectively. Concerning the regimen, about 140 (37.9%), 193 (52.3%), and 36 (9.8%) patients were treated with monotherapy, two therapies, and three or more therapies, respectively. Furthermore, 68 (18.4%), 57 (15.4%), 178 (48%), and 66 (18.2%) patients took amlodipine, enalapril, a combination of amlodipine and enalapril, and other drugs, respectively (Table 1). About 235 (63.7%) hypertensive patients treated at the JUMC attained the event of interest (the first remission). During the follow-up period, 135 (36.6%) of the 235 hypertensive patients having the first remission were male, and 105 (28.5%) of them resided in the urban area. History of CVD and CKD and residence were significantly associated with the time to the first remission of hypertensive patients.
Table 1.
Frequency distribution of variables with survival status and their association
|
Variables
|
Censored (n=134)
|
Event (n=235)
|
Total (n=369)
|
P
value
|
|
Number
|
Percent
|
Number
|
Percent
|
Number
|
Percent
|
| Gender |
| Female |
68 |
18.40 |
100 |
27.5 |
168 |
45.5 |
0.158 |
| Male |
66 |
17.9 |
135 |
36.6 |
201 |
54.5 |
| Residence |
| Urban |
85 |
23.0 |
105 |
28.5 |
190 |
51.5 |
0.001 |
| Rural |
49 |
13.3 |
130 |
35.2 |
179 |
48.5 |
| Diabetes mellitus |
| No |
111 |
30.1 |
207 |
56.1 |
318 |
86.2 |
0.212 |
| Yes |
23 |
6.2 |
28 |
7.6 |
51 |
13.8 |
| Cardiovascular disease |
| No |
119 |
32.3 |
182 |
49.3 |
301 |
81.6 |
0.010 |
| Yes |
15 |
4.0 |
53 |
14.4 |
68 |
18.4 |
| Stroke |
| No |
41 |
11.1 |
87 |
23.6 |
128 |
34.7 |
0.257 |
| Yes |
93 |
25.2 |
148 |
40.1 |
241 |
65.3 |
| Chronic kidney disease |
| No |
125 |
33.9 |
179 |
48.5 |
304 |
82.4 |
0.001 |
| Yes |
9 |
2.4 |
56 |
15.2 |
65 |
17.6 |
| Regimen |
| Monotherapy |
55 |
14.9 |
85 |
23.0 |
140 |
37.9 |
0.497 |
| Two therapies |
63 |
17.0 |
130 |
35.3 |
193 |
52.3 |
| Three or more therapies |
16 |
4.4 |
20 |
5.4 |
36 |
9.8 |
| Treatment |
| Amlodipine |
30 |
8.4 |
38 |
10.0 |
68 |
18.4 |
0.062 |
| Enalapril |
21 |
5.7 |
36 |
9.7 |
57 |
15.4 |
| Combinations |
68 |
18.2 |
110 |
29.8 |
178 |
48.0 |
Source. Jimma University Medical Center, Ethiopia; the study was performed from 1st September 2018 to 30th August 2021.
The average SBP and DBP of hypertensive patients were 157.2 (SD = 20.6) mm Hg and 99.6 (SD = 11.7) mm Hg, respectively. The median remission time to have the first remission of hypertensive patients was 5 months. The average creatinine and BUN levels of hypertensive outpatients were 2.2 (SD = 2.1) and 69.2 (55.4) in mg/dL, respectively. In addition, as regards age, it was 47.9 (SD = 16.4) years.
Figure 1 visualizes the individual plots of DBP and SBP. Based on the plot, there was a moderate status within and between individual variations of both outcome measurements over the observation time, indicating that patients began with both varying baselines and different evolutions over time. It also demonstrates the average trend line of both outcome measures, confirming a decreasing trend for both outcomes.
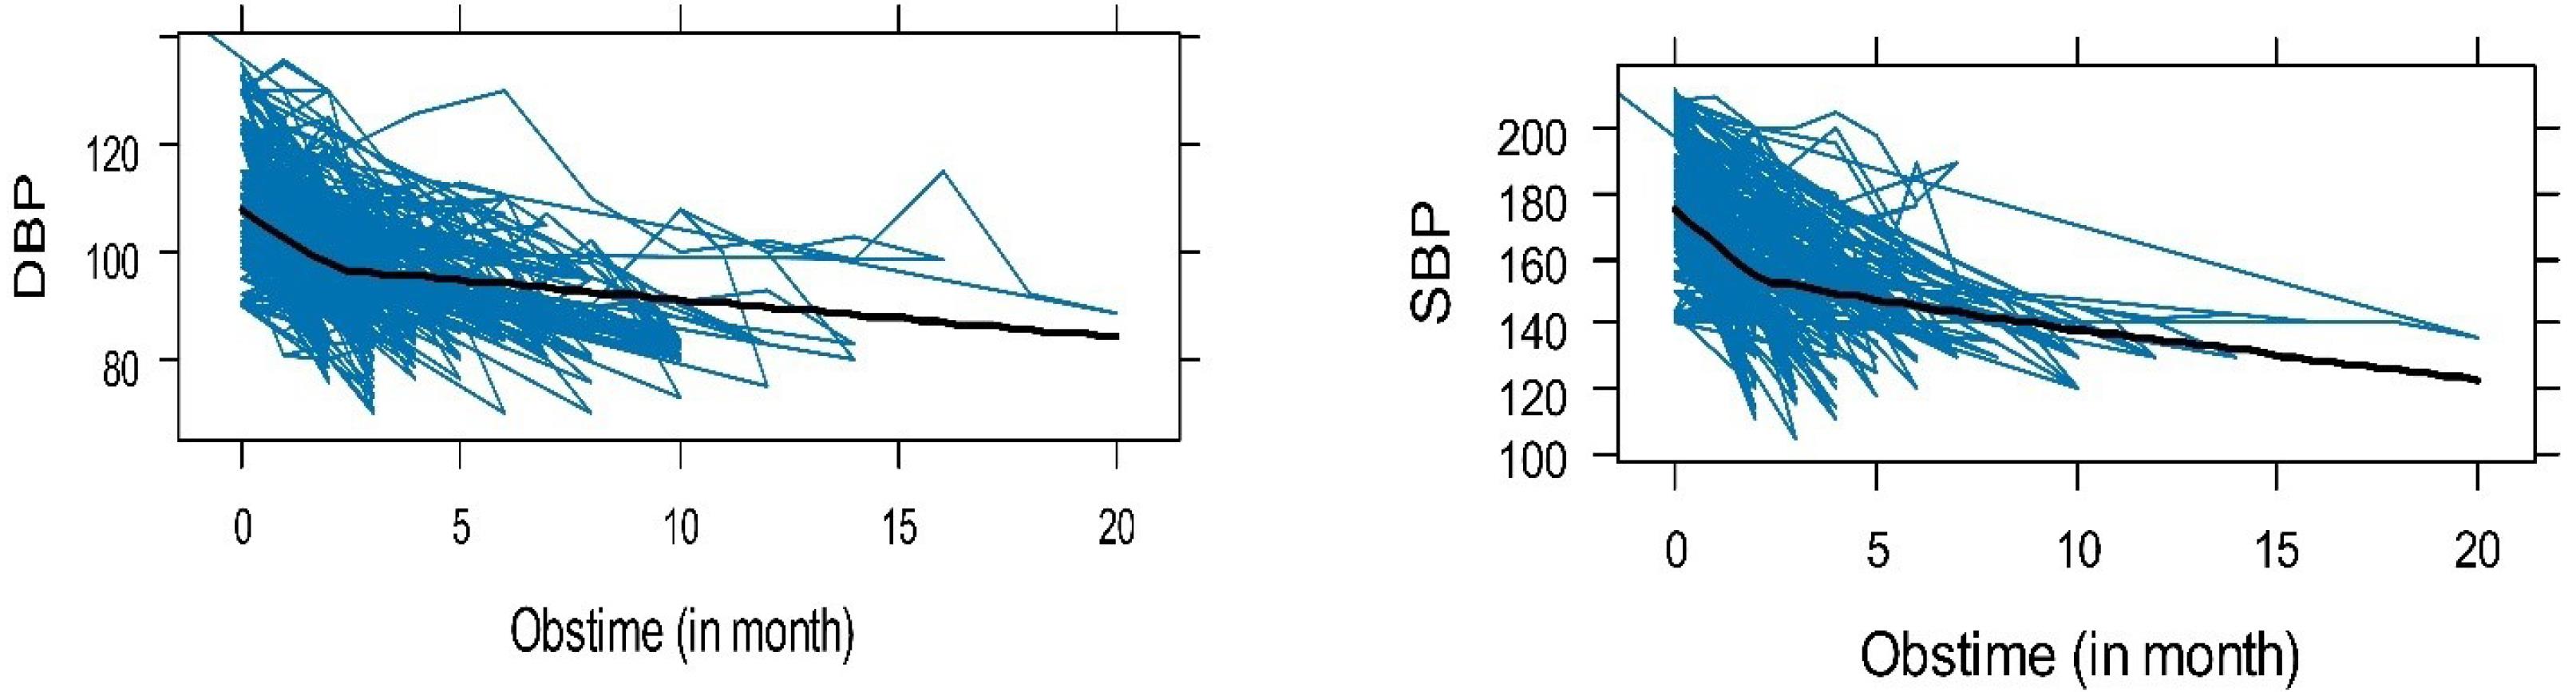
Figure 1.
Individual profile plot with average trend line of systolic and diastolic blood pressure
.
Individual profile plot with average trend line of systolic and diastolic blood pressure
The mean progress of both SBP and DBP is shown in Figure 2. This picturized progress of both BP indicates that they have constant changes or progress throughout the visit time. The average of SBP varies between 150 mm Hg and 160 mm Hg, whereas DBP varies between 90 mm Hg and 105 mm Hg.
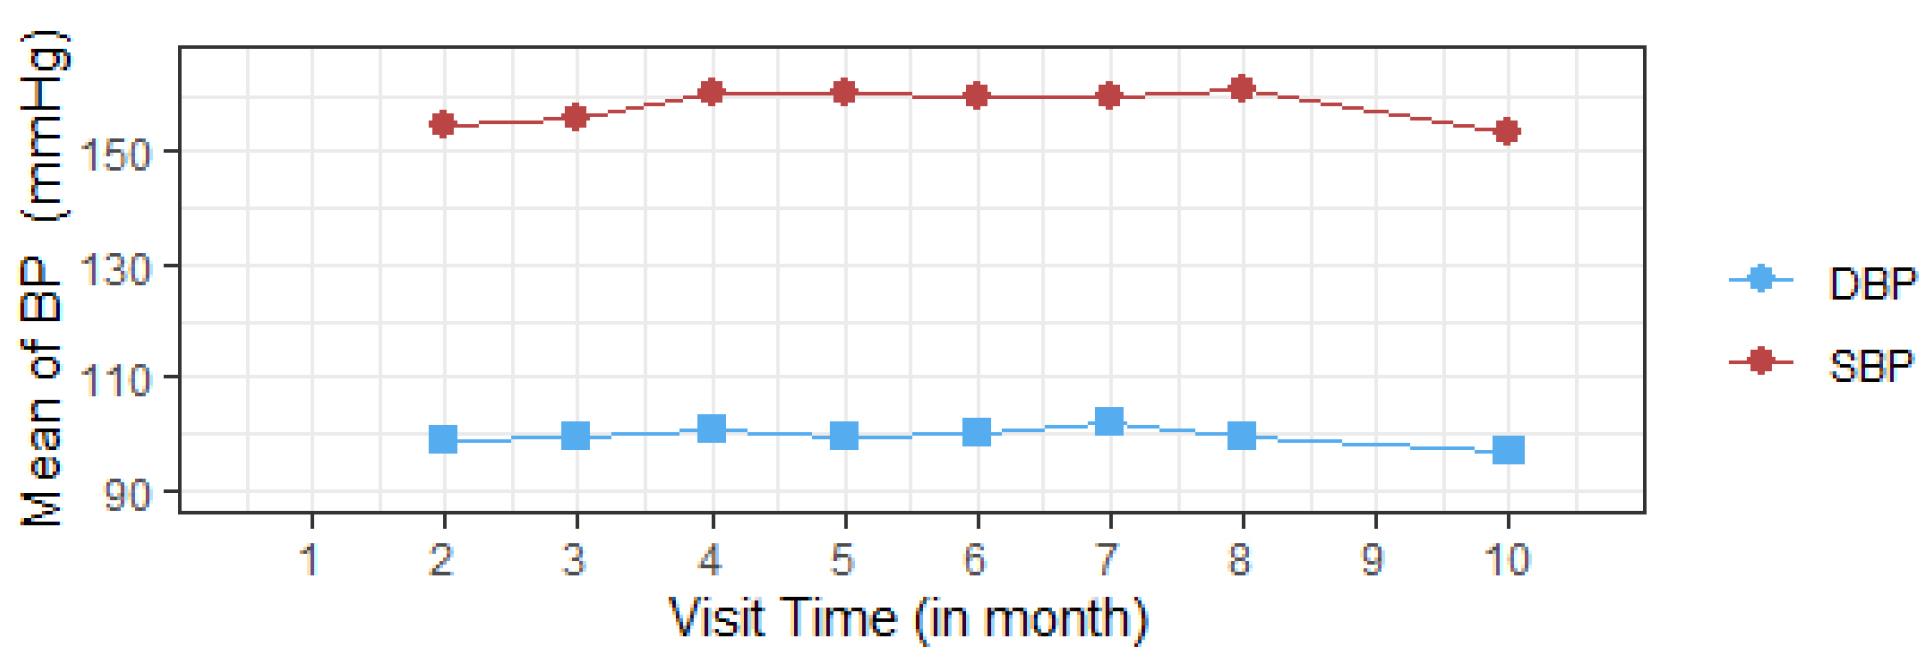
Figure 2.
Mean profile plot of systolic and diastolic blood pressure
.
Mean profile plot of systolic and diastolic blood pressure
Furthermore, the plot of the Kaplan-Meier estimate of the survivor function is a step function (Figure 3), in which the estimated time to first remission probabilities is constant between adjacent event times but it decreases at each event time. It implies that as a patient’s survival time increases, the probability that hypertensive patients get their first remission decreases over time.
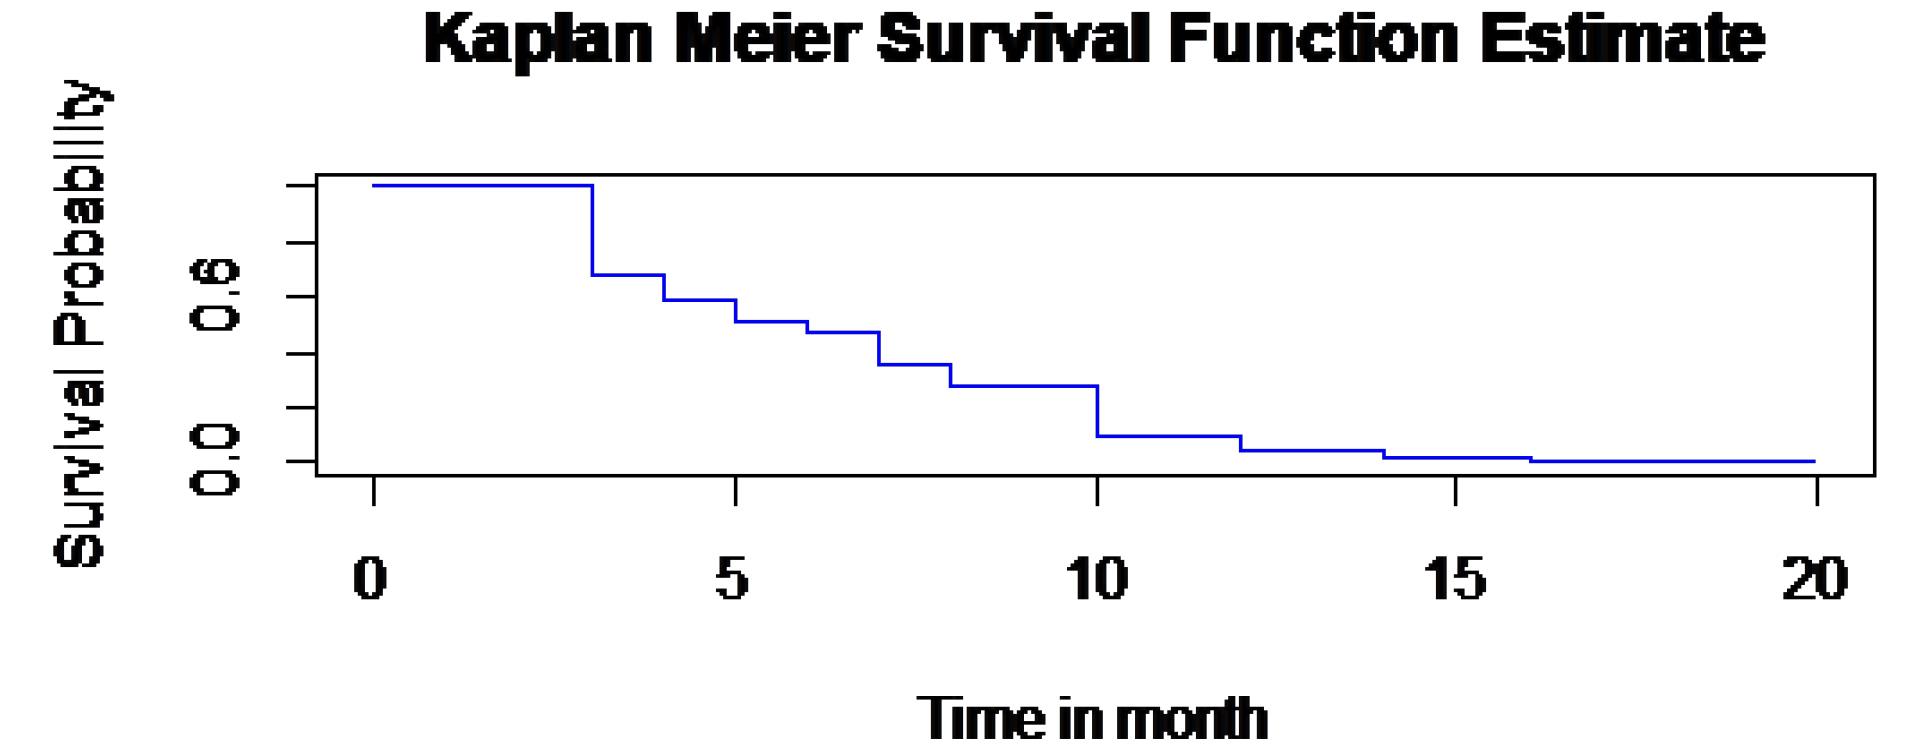
Figure 3.
The overall estimate of Kaplan-Meier survivor function plot
.
The overall estimate of Kaplan-Meier survivor function plot
Similarly, the time to first remission of the patients was described using the Kaplan–Meier survival curves (Figure 4).
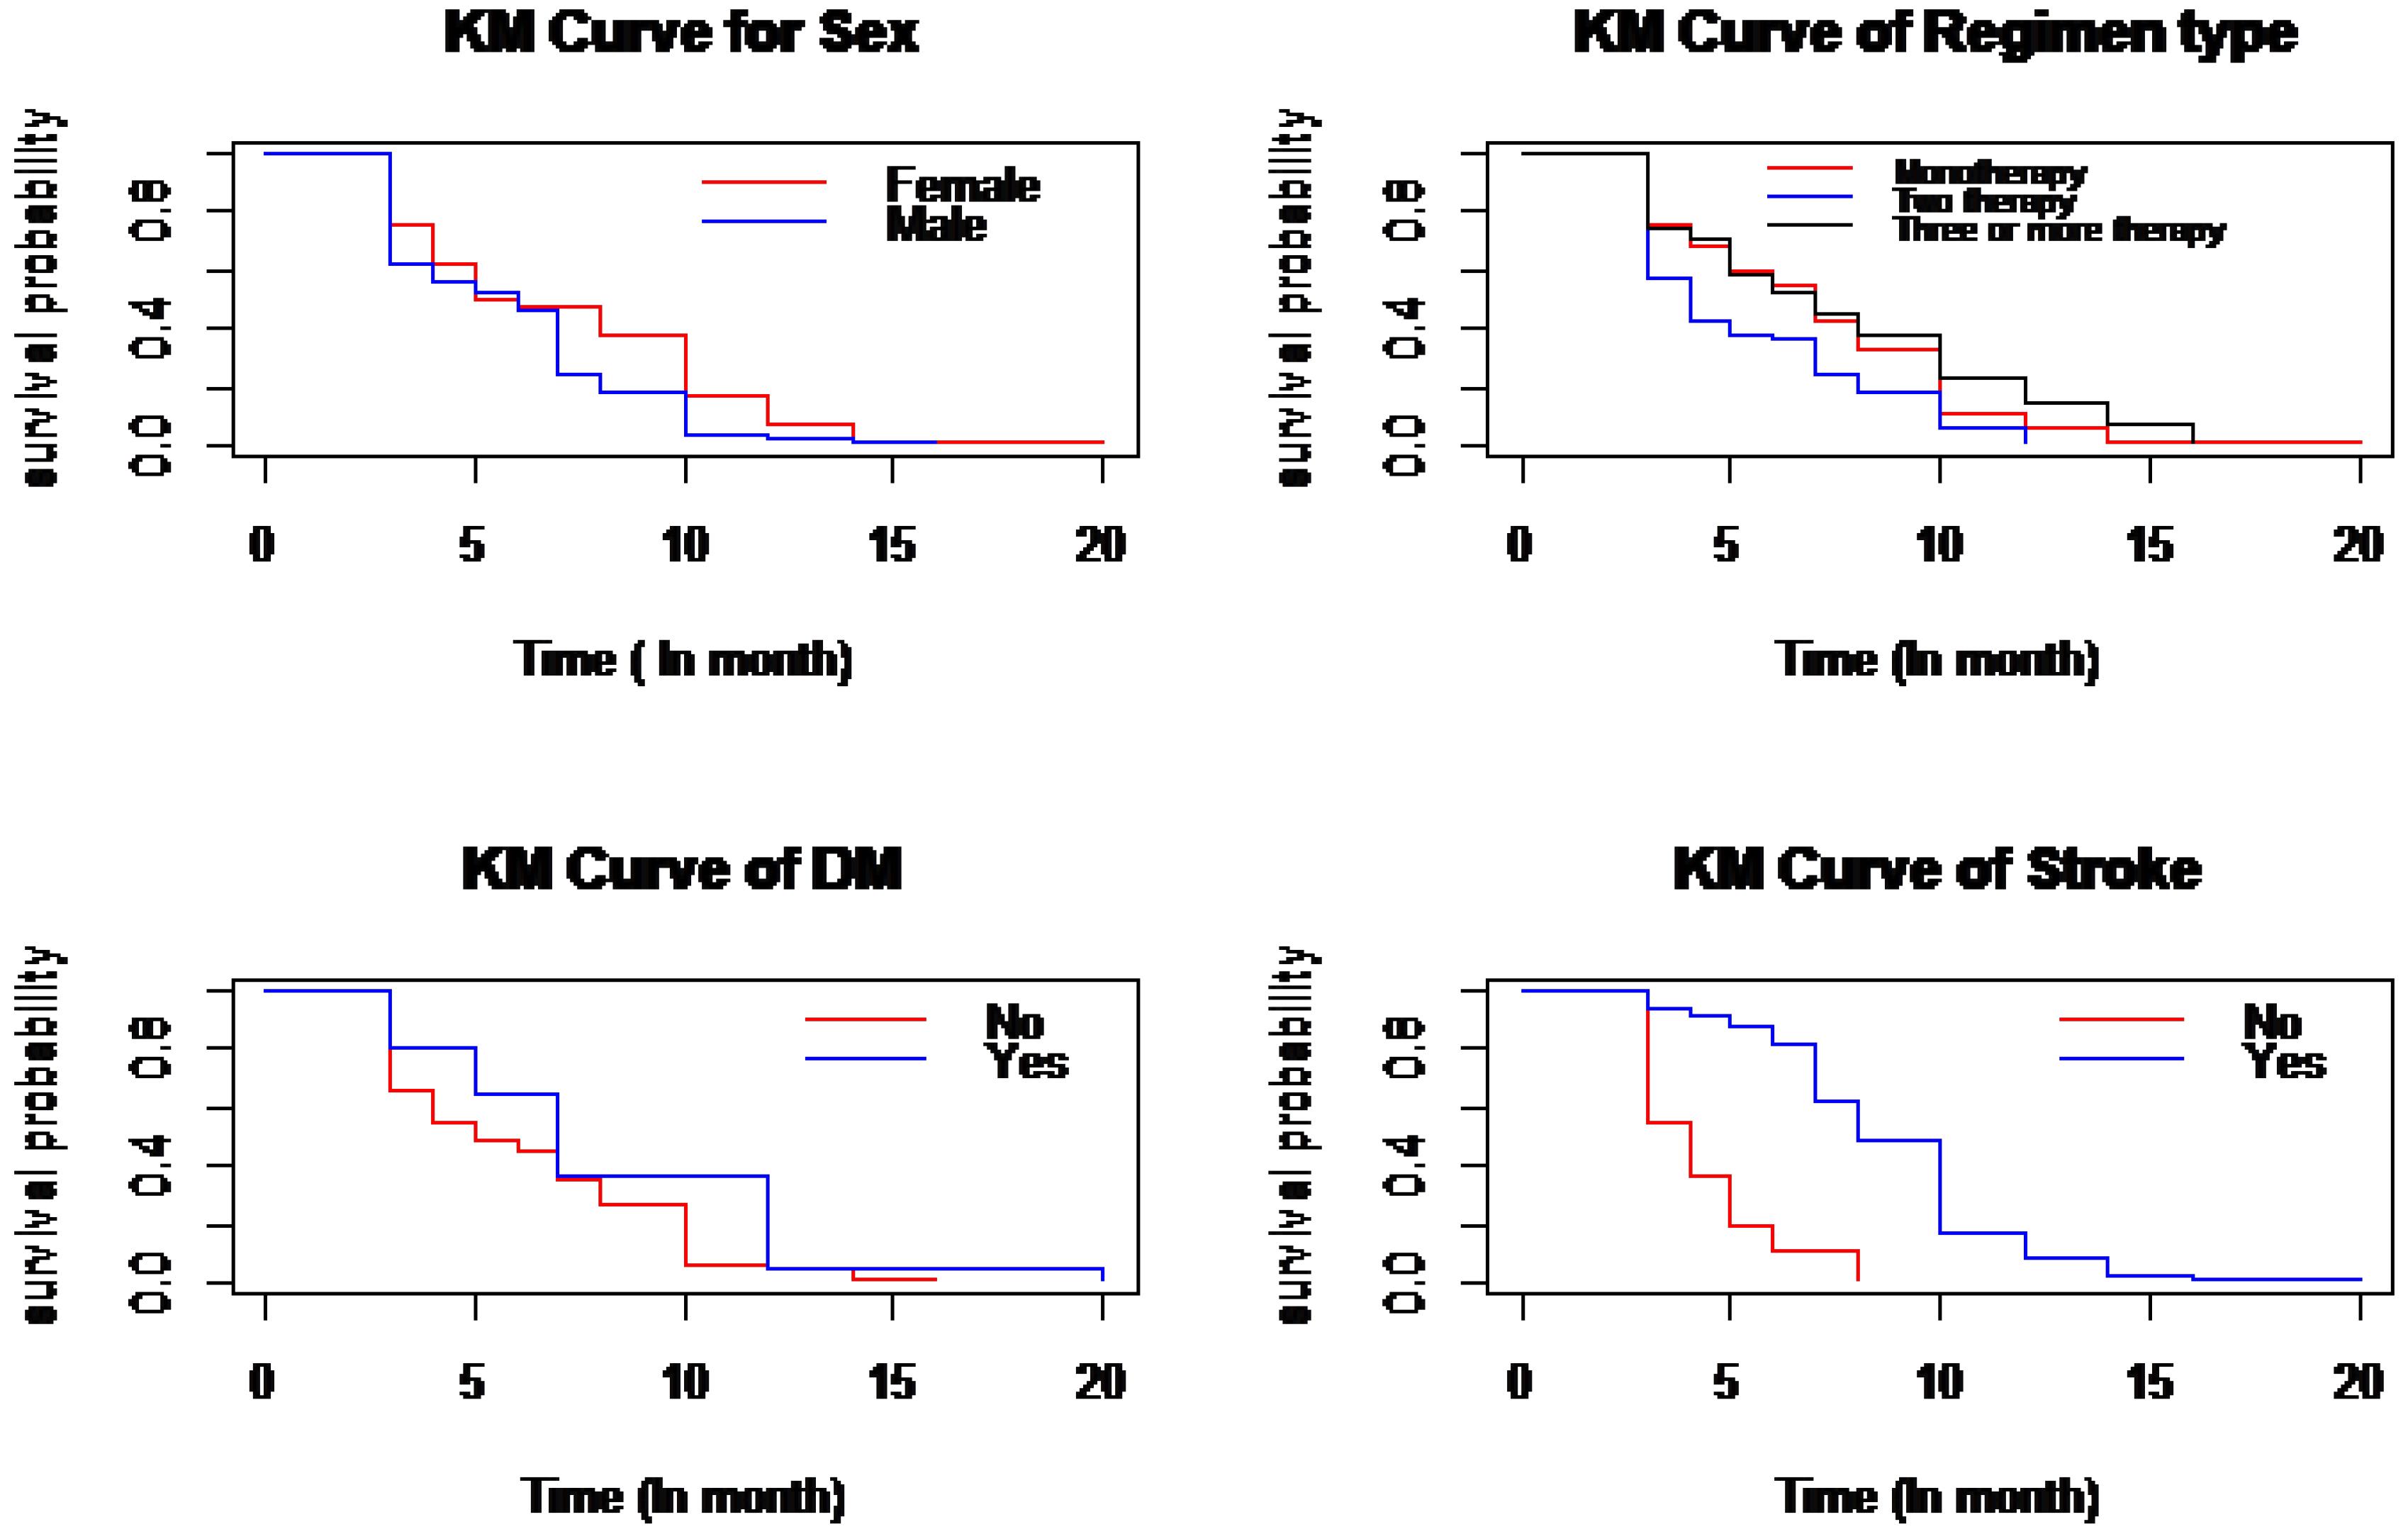
Figure 4.
Plot of Kaplan Meier survival curves
.
Plot of Kaplan Meier survival curves
The result of the variance-covariance matrix from SAS PROC MIXED shows that the variability is higher for SBP (random slope = 30.6981) than for DBP (random slope = 10.6804), indicating that SBP is more variable than DBP over time. Additionally, a high correlation was found between the random intercept of SBP and DBP (0.8588), implying that a patient with a higher initial SBP is likely to have a higher initial DBP. In addition, the association of evolution of SBP and DBP was 0.9923; this suggests that there has been a strong positive association between changes in SBP and DBP over time, and the evolution of association was determined using the marginal correlation between two responses, SBP and DBP, at different visit times. This result is depicted by plotting the marginal correlation over the observation time (Figure 5). This result demonstrates that the evolution of the association of BP levels in hypertensive patients is slightly incremental after the third visit.
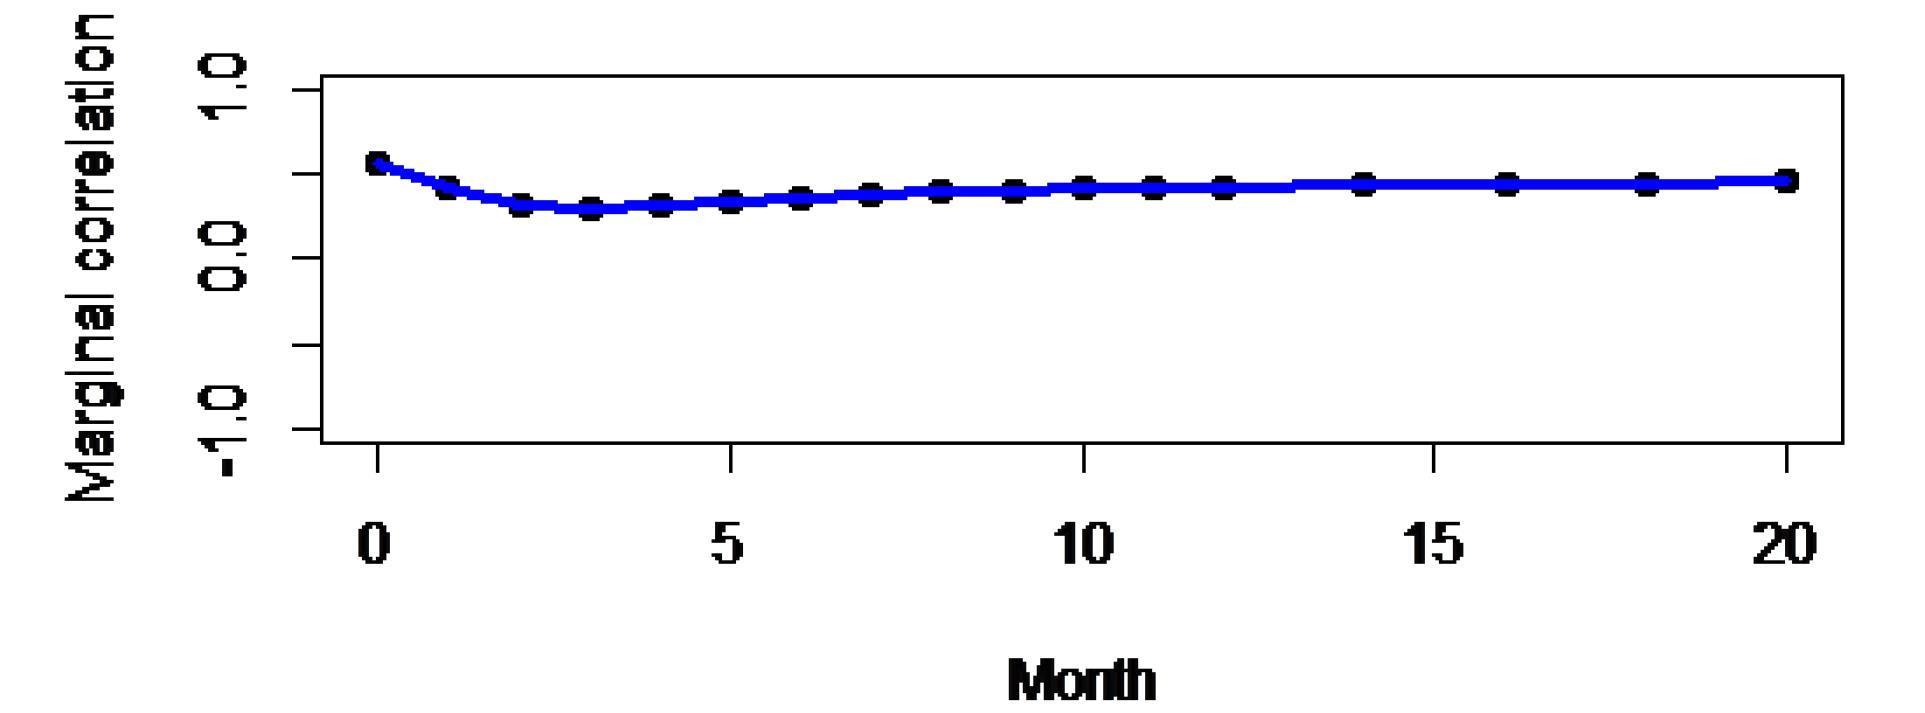
Figure 5.
Evolutions of associations
.
Evolutions of associations
Univariable and multivariable analyses were applied to fit MVJM of BP with time to first remission. In univariable analysis, the model containing each covariate at a time was fitted to determine variables that have the potential for being included in the multivariable analysis. Covariates in the univariable analysis with P values less than 25% were considered for multi-variable analysis.
In univariable analysis, covariates such as gender, comorbidity (CKD, stroke, and DM), baseline age of the patient, BUN level, residence, treatment that patient took, and observation time were included in the linear model of SBP, and for DBP, covariates such as treatment, residence, gender, comorbidity (DM and stroke), BUN level, and observation time were significant at a 25% level of significance. However, the other covariates (e.g., CVD and serum creatinine level) were not significant at the 25% level of significance, and thus they were excluded from the multivariable analysis. Similarly, covariates such as baseline age of the patients, residence, gender, and comorbidity (CKD, DM, stroke, and CVD) were significant at a 25% level of significance and were included in MVJM, whereas others were excluded from the investigation.
The MVJM explicitly links BP and time-to-first remission processes through the current value association structures parameterization, simultaneously providing a measure of the strength of the association between changes in BPs and the time-to-first remission process. The “mjoint ()” function was applied under the joineRML package to extract the necessary information for MVJM analysis.
The dataset was fitted with only random intercept and with random intercept and slope under an MVJM. The model with only random intercept had an AIC value of 27233.33, whereas the one with random intercept and slope had a 27024 AIC value. As a result, the most appropriate model is the MVJM fitted with random intercept and slope, which has the lowest AIC value.
The finding revealed that the average SBP and DBP of patients had a 4.4021 mm Hg and 3.0757 mm Hg increment for hypertensive patients who had a history of DM than those patients with no history of DM. Those patients who were taking a combination of enalapril and amlodipine showed a 5.4088 (SE = 2.1581, P = 0.0122) mm Hg decrement in SBP compared to those who were taking a single amlodipine once daily. Similarly, as the patients’ BUN levels increased by a unit mg/dL, the average SBP and DBP increased by 0.0316 mm Hg (SE = 0.0159) and 0.0208 mm Hg (SE = 0.0096), respectively (Table 2).
Table 2.
Multivariate joint model parameter estimates for longitudinal and survival processes
|
Longitudinal Sub-model
|
|
Variables
|
Estimate value
|
SE
|
P
value
|
95% CI of estimate value
|
| Intercept |
160.0960 |
3.2660 |
0.0001 |
153.6940 |
166.4970 |
| Treatment (Enalapril) |
1.4086 |
2.6107 |
0.5895 |
-3.7082 |
6.5255 |
| Treatment (Combination) |
-5.4088 |
2.1581 |
0.0122 |
-9.6386 |
-1.1791 |
| Treatment (Others) |
-0.9401 |
2.3909 |
0.6942 |
-5.6260 |
3.7460 |
| Gender (Male) |
3.9378 |
1.7367 |
0.0234 |
-7.3417 |
-5.3393 |
| CKD (Yes) |
3.8075 |
1.8540 |
0.0400 |
0.1738 |
7.4412 |
| DM (Yes) |
4.4021 |
2.1822 |
0.0437 |
0.1250 |
8.6792 |
| Stroke (Yes) |
9.9962 |
2.3101 |
0.0001 |
5.4686 |
14.5239 |
| Age (Year) |
0.1916 |
0.0438 |
0.0001 |
0.1058 |
0.2775 |
| Residence (Urban) |
5.3566 |
1.7592 |
0.0023 |
1.9086 |
8.8047 |
| BUN |
0.0316 |
0.0159 |
0.0469 |
0.0434 |
0.0628 |
| Observation time (Obstime) |
-8.6962 |
0.4547 |
0.0001 |
-9.5875 |
-7.8050 |
|
Diastolic blood pressure
|
| Intercept |
101.2576 |
1.5729 |
0.0001 |
98.1749 |
104.3400 |
| Treatment (Enalapril) |
1.9019 |
1.6393 |
0.2460 |
-1.3109 |
5.1148 |
| Treatment (Combination) |
1.2184 |
1.4303 |
0.3943 |
-1.5850 |
4.0218 |
| Treatment (Others) |
1.8930 |
1.5830 |
0.2318 |
-1.2097 |
4.9960 |
| Residence (Urban) |
1.3397 |
1.0081 |
0.1839 |
-0.6361 |
3.3156 |
| Gender (Male) |
-2.1046 |
0.9159 |
0.0216 |
-3.9000 |
-0.3095 |
| DM (Yes) |
3.0757 |
1.3138 |
0.0192 |
0.5007 |
5.6508 |
| Stroke (Yes) |
4.7947 |
1.4601 |
0.0010 |
1.9330 |
7.6566 |
| BUN |
0.0208 |
0.0096 |
0.0314 |
0.0019 |
0.0397 |
| Observation time |
-2.5437 |
0.1101 |
0.0001 |
-2.7595 |
-2.3280 |
|
Time-to-event sub-model
|
| Age |
-0.0092 |
0.0103 |
0.3706 |
-0.0293 |
0.0109 |
| Residence (Urban) |
-0.4938 |
0.3307 |
0.1354 |
-1.1420 |
0.1544 |
| Gender (Male) |
0.5930 |
0.3252 |
0.0682 |
-0.0443 |
1.2303 |
| CKD (Yes) |
-0.5852 |
0.4329 |
0.1764 |
-1.4334 |
0.2633 |
| CVD (Yes) |
-1.0038 |
0.3958 |
0.0112 |
-1.7780 |
-0.2280 |
| DM (Yes) |
-0.7638 |
0.5407 |
0.1577 |
-1.8235 |
0.2960 |
| Stroke (Yes) |
-1.9549 |
0.3898 |
0.0001 |
-2.7190 |
-1.1910 |
| BUN |
-0.0054 |
0.0032 |
0.0872 |
-0.0117 |
7.9168 |
| γ1 |
-0.0693 |
0.0161 |
0.0001 |
-0.1010 |
-0.0377 |
| γ2 |
-0.0412 |
0.0499 |
0.4093 |
-0.1390 |
0.0566 |
|
Random effects
|
|
Coefficient
|
Variance
|
SD
|
αi1
|
bi1
|
αi2
|
| αi1 |
255.060 |
15.97 |
1.000 |
-0.7144 |
0.6467 |
| bi1 |
18.0120 |
4.244 |
- |
1.000 |
-0.1196 |
| αi2 |
36.7320 |
6.064 |
- |
- |
1.000 |
| ϵi1 |
113.96 |
10.675 |
- |
- |
- |
| ϵi2 |
73.462 |
8.571 |
- |
- |
- |
Note. SE: Standard error; CI: Confidence interval; SD: Standard deviation; CKD: Chronic kidney disease; DM: Diabetes mellitus; CVD: Cardiovascular disease; BUM: Blood urea nitrogen. γ1 and γ2 are the association parameters for the current true value of SBP and DBP, respectively. The αi and bi correspond to random intercept and slope.
The hazard of first remission for patients who had a history of stroke was 0.1416 (HR = exp (–1.9549)) times less likely than that of those patients who had no history of stroke. In other words, the time to attain first remission for those patients who had a history of stroke was 85.84% lower than that of patients who had no history of stroke. Moreover, the probability of having first remission for patients who had a history of CVD was 0.3665 (HR = exp (–1.0038)) less likely than that of patients who had no history of CVD (Table 2). The estimate of the association parameter for the current true value of SBP (γ1) was -0.0693 (HR = exp (–0.0693) = 0.93); this revealed that there was a 0.93 decrement change in the risk of first remission of patients as the current true value of SBP increases in a unit mm Hg. However, the association parameter for the current true value of DBP (γ2) was not significant.
Discussion
In this study, the joint longitudinal of SBP and DBP was used to evaluate the association between two longitudinal progresses, whereas the MVJM of SBP and DBP with time to first remission was utilized on the datasets of hypertensive patients obtained from JUMC. This statistical method was employed to identify the determinant risk factors of longitudinal changes in BP and time to first remission of hypertensive patients and to evaluate the association between the current true values of BP with time to first remission of the patients.
The results of the joint bivariate longitudinal model revealed that there was a strong association between BP evolutions; this is in line with the findings of a study conducted at Jimma University, which confirmed a strong association between the evolution of SBP and DBP.29 Concerning the evolution of the association of BP measurements, in this study, after the third observation, the evolutions of associations slightly increased, which is consistent with the results of previous studies demonstrating that there was a slight increase in the correlation between DBP and SBP over time.4,29
In the multivariate longitudinal sub-model, the observation time was negatively associated with the average progress of SBP and DBP, implying that the average progress of SBP and DBB decreased with an increase in the patient’s observation time. This report is in line with the report of the study conducted at Jimma University13 and Felege Hiwot Referral Hospital.30 However, age and SBP of the patients were positively associated, revealing that a one-year increase in age was associated with a normal increase of SBP.4,13,31,32
Concerning the anti-hypertensive drugs that patients took, a combination of amlodipine and enalapril was negatively associated with SBP, indicating that their combination decreased the average SBP of hypertensive patients. This result is consistent with the findings of the study conducted on the combination of therapy in HTN, indicating that effective BP reductions were achieved with combination therapy compared to either of the monotherapies.33,34 This is because several factors contribute to HTN, and it may be impractical to regulate BP with a single medication that acts through a single mechanism; thus, combination therapy may be a more practical option.
Patients with a history of DM and stroke showed an average BP (DBP and SBP) that was higher than that of those without such a history. This finding is consistent with the results of studies performed in the northwest of Ethiopia,35,36 southwest Ethiopia,13 and China.37 Likewise, a history of kidney disease was significantly associated with uncontrolled SBP in HTN patients. The average SBP of patients with a history of CKD increased compared to that of those with no history of CKD, which conforms to the results of studies performed in South Asia and China, which showed that diabetic and kidney disease co-morbidities were associated with uncontrolled HTN.36,38
The patient’s residence was significantly associated with the average SBP of patients but not with the DBP of the patients, which corroborates the findings of a study conducted in the southwest of Ethiopia.29 The gender of patients was significantly associated with the BP progress; however, there may be disparities between the study reports and those of other studies. This is due to differences in the study area, the presence of comorbidity, environmental variations, and the physical activity trend of patients.36,39
The current true value association parameter in joint analysis for SBP with time to first remission was significant at the 5% level of significance, indicating that there was an association between the current true value of SBP measurement and the risk of first remission, and the risk of first remission was decreased with a unit increase in the value of SBP measurement. This result is in accordance with that of the study conducted at Arba Minch General Hospital, confirming that there was a strong association between SBP measurement and survival time of HTN patients.18
Finally, as taking the combination of amlodipine and enalapril drugs decreases the BP of patients, it is better to treat patients with the appropriate combination of anti-hypertensive drugs by considering their comorbidity. The advanced MVJM was used in this work, which was a simultaneous analysis when there were more than two longitudinal measurements and a time to event. Despite the strength of this study, there were also significant limitations to this study. There may be more than two remission times for hypertensive patients, which was not considered in this study. Accordingly, in addition to the first remission, future studies should apply the JM, which accounts for multiple longitudinal outcomes with multiple time-to-event outcomes.
Highlights
-
Overall, 235 (63.7%) hypertensive patients treated at JUMC attained the first remission.
-
Patients receiving a combination of anti-hypertensive drugs were more likely to have first remission than those receiving single drugs.
-
Time to first remission was correlated with patients’ systolic blood pressure (SBP).
-
Patients having comorbidity stayed a long time without having the first remission.
Conclusion
Based on the findings, patients receiving a combination of treatments had lower SBP and DBP as compared to others who only received amlodipine anti-hypertensive drugs, which may take the patients as they have first remission within a short period of time. In other words, the risk of having first remission was significantly increased. This justification was observed from the JM of the longitudinal and time-to-event models. On the other hand, having a history of comorbidity could significantly determine the time to first remission of patients. Patients who had a good follow-up and took a combination of drugs have an opportunity to decrease their BP. This makes patients have their first remission within a short period of time than others. In addition, patients’ age and history of stroke, DM, and CKD were the joint determinants of longitudinal changes in BP and the first remission time, which makes patients not to have first remission early. Decreasing BP leads to good control of HTN by all means.
Acknowledgements
The authors would gratefully like to acknowledge JUMC for providing data.
Competing Interests
The authors declare that there was no conflict of interests in this study.
Ethical Approval
Ethical approval was obtained from the Institutional Research Ethics Review Committee of the Jimma University College of Natural Sciences. A letter of support was written to Advanced Healthcare Management Corporation (AHMC). The authors submitted an official letter to AHMC. After clarifying the purposes of the study, the secondary data were obtained from all subjects and/or their legal guardian(s) for the participated cases who were adults above 18 years old. All methods were performed following the relevant guidelines and regulations.
Funding
There was no direct fund for this study.
References
- Akpa MR, Emem-Chioma PC, Odia OJ. Current epidemiology of hypertension in Port Harcourt metropolis, Rivers state, Nigeria. Port Harcourt Med J 2008; 2(3):218-23. doi: 10.4314/phmedj.v2i3.38922 [Crossref] [ Google Scholar]
- Kumar P, Clark ML. Kumar and Clark’s Clinical Medicine E-Book. Elsevier Health Sciences; 2012.
- Asekun-Olarinmoye E, Akinwusi P, Adebimpe W, Isawumi M, Hassan M, Olowe O. Prevalence of hypertension in the rural adult population of Osun state, southwestern Nigeria. Int J Gen Med 2013; 6:317-22. doi: 10.2147/ijgm.s42905 [Crossref] [ Google Scholar]
- Workie DL, Zike DT, Fenta HM. Bivariate longitudinal data analysis: a case of hypertensive patients at Felege Hiwot Referral Hospital, Bahir Dar, Ethiopia. BMC Res Notes 2017; 10(1):722. doi: 10.1186/s13104-017-3044-4 [Crossref] [ Google Scholar]
- Fieuws S, Verbeke G. Pairwise fitting of mixed models for the joint modeling of multivariate longitudinal profiles. Biometrics 2006; 62(2):424-31. doi: 10.1111/j.1541-0420.2006.00507.x [Crossref] [ Google Scholar]
- Schutte AE, Srinivasapura Venkateshmurthy N, Mohan S, Prabhakaran D. Hypertension in low- and middle-income countries. Circ Res 2021; 128(7):808-26. doi: 10.1161/circresaha.120.318729 [Crossref] [ Google Scholar]
- Hisamatsu T, Segawa H, Kadota A, Ohkubo T, Arima H, Miura K. Epidemiology of hypertension in Japan: beyond the new 2019 Japanese guidelines. Hypertens Res 2020; 43(12):1344-51. doi: 10.1038/s41440-020-0508-z [Crossref] [ Google Scholar]
- Shishani K, Dajani R, Khader Y. Hypertension risk assessment in the largest ethnic groups in Jordan. J Immigr Minor Health 2013; 15(1):43-8. doi: 10.1007/s10903-011-9533-y [Crossref] [ Google Scholar]
- Ong KL, Cheung BM, Man YB, Lau CP, Lam KS. Prevalence, awareness, treatment, and control of hypertension among United States adults 1999-2004. Hypertension 2007; 49(1):69-75. doi: 10.1161/01.hyp.0000252676.46043.18 [Crossref] [ Google Scholar]
- Hendriks ME, Wit FW, Roos MT, Brewster LM, Akande TM, de Beer IH. Hypertension in sub-Saharan Africa: cross-sectional surveys in four rural and urban communities. PLoS One 2012; 7(3):e32638. doi: 10.1371/journal.pone.0032638 [Crossref] [ Google Scholar]
- Van Minh H, Byass P, Chuc NT, Wall S. Gender differences in prevalence and socioeconomic determinants of hypertension: findings from the WHO STEPs survey in a rural community of Vietnam. J Hum Hypertens 2006; 20(2):109-15. doi: 10.1038/sj.jhh.1001942 [Crossref] [ Google Scholar]
- Amare F, Hagos B, Sisay M, Molla B. Uncontrolled hypertension in Ethiopia: a systematic review and meta-analysis of institution-based observational studies. BMC Cardiovasc Disord 2020; 20(1):129. doi: 10.1186/s12872-020-01414-3 [Crossref] [ Google Scholar]
- Jabir YN, Liga AD, Bacha RH, Chere FZ. Longitudinal systolic and diastolic blood pressure change over time and associated risk factors in patients with hypertension in southwest Ethiopia: a prospective study. Afr J Health Sci 2021; 34(1):12-25. [ Google Scholar]
- Gebreyes YF, Goshu DY, Geletew TK, Argefa TG, Zemedu TG, Lemu KA. Prevalence of high bloodpressure, hyperglycemia, dyslipidemia, metabolic syndrome and their determinants in Ethiopia: evidences from the National NCDs STEPS Survey, 2015. PLoS One 2018; 13(5):e0194819. doi: 10.1371/journal.pone.0194819 [Crossref] [ Google Scholar]
- Kebede B, Ayele G, Haftu D, Gebremichael G. The prevalence and associated factors of hypertension among adults in southern Ethiopia. Int J Chronic Dis 2020; 2020:8020129. doi: 10.1155/2020/8020129 [Crossref] [ Google Scholar]
- Helelo TP, Gelaw YA, Adane AA. Prevalence and associated factors of hypertension among adults in Durame town, southern Ethiopia. PLoS One 2014; 9(11):e112790. doi: 10.1371/journal.pone.0112790 [Crossref] [ Google Scholar]
- Fieuws S, Verbeke G. Pairwise fitting of mixed models for the joint modeling of multivariate longitudinal profiles. Biometrics 2006; 62(2):424-31. doi: 10.1111/j.1541-0420.2006.00507.x [Crossref] [ Google Scholar]
- Kosa HA, Erango MA. Joint modeling of blood pressure measurement and survival time of hypertension patients. Sci Rep 2021; 11(1):15731. doi: 10.1038/s41598-021-94905-y [Crossref] [ Google Scholar]
- Lawrence Gould A, Boye ME, Crowther MJ, Ibrahim JG, Quartey G, Micallef S. Joint modeling of survival and longitudinal non-survival data: current methods and issues Report of the DIA Bayesian joint modeling working group. Stat Med 2015; 34(14):2181-95. doi: 10.1002/sim.6141 [Crossref] [ Google Scholar]
- Papageorgiou G, Mauff K, Tomer A, Rizopoulos D. An overview of joint modeling of time-to-event and longitudinal outcomes. Annu Rev Stat Appl 2019; 6(1):223-40. doi: 10.1146/annurev-statistics-030718-105048 [Crossref] [ Google Scholar]
- Rizopoulos D. Joint Models for Longitudinal and Time-to-Event Data: With Applications in R. CRC Press; 2012.
- Yang L. Joint Models for Longitudinal and Survival Data. Indiana University; 2013.
- Sendek EM, Hebo SH. Modeling time-to-good control of hypertension using Cox proportional hazard and frailty models at Bahir-Dar Felege Hiwot Referral Hospital. Open Access Med Stat 2017; 7:27-36. doi: 10.2147/oams.s128088 [Crossref] [ Google Scholar]
- Kosa HA, Erango MA. Joint modeling of blood pressure measurement and survival time of hypertension patients. Sci Rep 2021; 11(1):15731. doi: 10.1038/s41598-021-94905-y [Crossref] [ Google Scholar]
- Yami A, Hamza L, Hassen A, Jira C, Sudhakar M. Job satisfaction and its determinants among health workers in Jimma University Specialized Hospital, southwest Ethiopia. Ethiop J Health Sci 2011; 21(Suppl 1):19-27. [ Google Scholar]
- Hickey GL, Philipson P, Jorgensen A, Kolamunnage-Dona R. Joint modelling of time-to-event and multivariate longitudinal outcomes: recent developments and issues. BMC Med Res Methodol 2016; 16(1):117. doi: 10.1186/s12874-016-0212-5 [Crossref] [ Google Scholar]
- Collett D. Modelling Survival Data in Medical Research. Chapman and Hall/CRC; 2023. p. 556.
- Quantin C, Moreau T, Asselain B, Maccario J, Lellouch J. A regression survival model for testing the proportional hazards hypothesis. Biometrics 1996; 52(3):874-85. [ Google Scholar]
- Negash Y, Kassahun W, Gurmessa A, Birlie B. Joint modeling of longitudinal systolic and diastolic blood pressure measurements of hypertensive patients receiving treatment. Electron J Appl Stat Anal 2016; 9(2):308-25. doi: 10.1285/i20705948v7n2p308 [Crossref] [ Google Scholar]
- Getaneh FT, Tesfaw LM, Dessie ZG, Derebe MA. Joint modeling of longitudinal changes of blood pressure and time to remission of hypertensive patients receiving treatment: Bayesian approach. PLoS One 2023; 18(2):e0281782. doi: 10.1371/journal.pone.0281782 [Crossref] [ Google Scholar]
- Zelelew AN, Workie DL. Joint modeling of blood pressure measurements and survival time to cardiovascular disease complication among hypertension patients follow-up at Debretabor hospital, Ethiopia. Vasc Health Risk Manag 2023; 19:621-35. doi: 10.2147/vhrm.s418568 [Crossref] [ Google Scholar]
- Wang W, Lee ET, Fabsitz RR, Devereux R, Best L, Welty TK. A longitudinal study of hypertension risk factors and their relation to cardiovascular disease: the Strong Heart Study. Hypertension 2006; 47(3):403-9. doi: 10.1161/01.hyp.0000200710.29498.80 [Crossref] [ Google Scholar]
- Kalra S, Kalra B, Agrawal N. Combination therapy in hypertension: an update. Diabetol Metab Syndr 2010; 2(1):44. doi: 10.1186/1758-5996-2-44 [Crossref] [ Google Scholar]
- Gradman AH, Basile JN, Carter BL, Bakris GL. Combination therapy in hypertension. J Clin Hypertens (Greenwich) 2011; 13(3):146-54. doi: 10.1111/j.1751-7176.2010.00397.x [Crossref] [ Google Scholar]
- Anteneh ZA, Yalew WA, Abitew DB. Prevalence and correlation of hypertension among adult population in Bahir Dar city, northwest Ethiopia: a community based cross-sectional study. Int J Gen Med 2015; 8:175-85. doi: 10.2147/ijgm.s81513 [Crossref] [ Google Scholar]
- Belew MA, Abate TW, Berhie AY, Abeje ED, Ayele DA, Abate MD. Determinants of hypertension among diabetes patients attending selected comprehensive specialized hospitals of the Amhara region, Ethiopia: an unmatched case-control study. PLoS One 2022; 17(12):e0279245. doi: 10.1371/journal.pone.0279245 [Crossref] [ Google Scholar]
- Song J, Sheng CS, Huang QF, Li LH, Ma CS, Guo XH. Management of hypertension and diabetes mellitus by cardiovascular and endocrine physicians: a China registry. J Hypertens 2016; 34(8):1648-53. doi: 10.1097/hjh.0000000000000994 [Crossref] [ Google Scholar]
- Yang L, Xu X, Yan J, Yu W, Tang X, Wu H. Analysis on associated factors of uncontrolled hypertension among elderly hypertensive patients in southern China: a community-based, cross-sectional survey. BMC Public Health 2014; 14:903. doi: 10.1186/1471-2458-14-903 [Crossref] [ Google Scholar]
- Ji H, Kim A, Ebinger JE, Niiranen TJ, Claggett BL, Bairey Merz CN. Sex differences in blood pressure trajectories over the life course. JAMA Cardiol 2020; 5(3):19-26. doi: 10.1001/jamacardio.2019.5306 [Crossref] [ Google Scholar]